ABSTRACT
This study analyzed acoustic emission (AE) signals generated during ultrasonic machining of SiC cathodes and evaluated classification performances of various machine learning models. AE data were collected in both waveform and hit formats, enabling signal characterization through statistical analysis and frequency domain examination. Various machine learning models, including XGBoost, KNN, Logistic Regression, SVM, and MLP, were applied to classify machining states. Results showed that XGBoost achieved the highest classification accuracy across all sensor positions, particularly at the upper part of the worktable with an accuracy of 98.35%. Additional experiments confirmed the consistency of these findings, highlighting the influence of sensor placement on classification performance. This study demonstrates the feasibility of monitoring AE-based machining state using machine learning and emphasizes the importance of sensor placement and signal analysis in improving classification accuracy. Future research should incorporate defect data and deep learning approaches to further enhance classification performance and process monitoring capabilities.
-
KEYWORDS: Acoustic emission, Ultrasonic machining, Signal analysis, Machine learning
-
KEYWORDS: 음향방출, 초음파 가공, 신호 분석, 머신러닝
1. 서론
반도체 제조 공정에서는 균일한 품질과 높은 정밀도를 유지하기 위해 정밀 가공 기술과 실시간 모니터링이 필수적이다. 특히, 식각 공정에서 사용되는 캐소드(Cathode)는 웨이퍼 표면에 균일한 플라즈마를 공급하는 핵심 부품으로, 마이크로 홀의 정밀도가 공정 효율성과 수율을 결정짓는 중요한 요인이다. 따라서, 고품질의 캐소드를 제작하기 위해서는 정밀한 가공 기술이 필수적이다.
실리콘 카바이드(Silicon Carbide, SiC)는 내화학성, 내열성, 내마모성이 뛰어나 반도체 및 항공우주 산업에서 중요한 소재로 활용되고 있다[
1-
4]. 그러나 높은 경도로 인해 가공이 어렵다는 한계를 가지며, 이를 극복하기 위해 다양한 가공 기법이 연구되고 있다. 기존에 사용된 레이저 가공(Laser Drilling), 전기방전 가공(Electrical Discharge Machining) 등의 방법은 SiC의 높은 경도와 취성으로 인해 균일한 품질을 유지하는 데 한계를 보였다. 이에 따라, 고주파 진동을 이용한 초음파 가공(Ultrasonic Machining)이 정밀성과 균일성 측면에서 더욱 효과적인 대안으로 평가된다[
5].
초음파 가공은 미세 홀을 높은 정밀도로 제작할 수 있다는 장점이 있지만, 가공 중 충격과 진동으로 인해 균열(Crack)과 같은 미세 결함이 발생할 가능성이 있다. 이는 부품의 신뢰성과 내구성을 저하시킬 수 있는 요인이므로, 가공 중 결함을 실시간으로 감지하고 공정을 최적화하기 위한 모니터링 기술이 필수적이다[
6].
음향방출(Acoustic Emission, AE) 기술은 가공 중 발생하는 탄성파를 감지하여 결함을 진단하는 비파괴 검사 방법이다. 음향방출 기반 모니터링은 미세한 결함도 감지할 수 있을 만큼 높은 정밀도를 갖는다는 점에서 주목받고 있다. 그러나 외부 잡음이나 환경 변화에 민감하게 반응하기 때문에, 신뢰성 높은 데이터를 확보하기 위해서는 적절한 센서 배치와 신호 처리 기법이 필요하다. 음향방출 신호는 수 MHz의 샘플링 속도로 파형(Waveform) 데이터가 수집된다. 이후 주요 특징이 추출되어 히트(Hit) 데이터로 변환되며, 이를 통해 실시간 분석이 가능하다. 파형 데이터와 히트 데이터는 상호 보완적으로 활용되어 가공 상태의 변화를 정밀하게 파악할 수 있으며, 이를 바탕으로 실시간 공정 모니터링이 가능하다[
7]. 기존 연구에서는 음향방출 기술을 기반으로 다양한 공정 모니터링 및 품질 평가 기법이 제안되어 왔다. Kim 등은 탄소섬유 강화플라스틱 복합재의 손상 모드를 분류하는 연구를 수행하였으며[
8], Oliveira 등은 음향방출과 적외선 신호를 활용하여 복합재 가공 공정을 모니터링하고 품질 및 손상 메커니즘을 평가하는 방법을 제안하였다[
9]. Guo 등은 고경도 소재 가공에서 음향방출 신호를 활용하여 백색층 형성과의 상관성을 분석하고, 이를 바탕으로 가공 품질을 개선할 수 있는 모니터링 시스템을 제시하였다[
10]. 또한, Park 등은 음향방출 신호의 특징을 추출한 뒤 머신러닝 기법을 활용하여 관형 철탑 볼트의 풀림 여부를 진단하는 모델을 구축하였다[
11]. Muir 등은 음향방출 신호를 분석하여 복합재의 손상 진행 과정을 파악하고, 머신러닝을 적용해 손상 유형을 자동으로 분류하는 방안을 제안하였다[
12].
이와 같이, 기존 연구들은 복합재료 및 금속 가공 공정에서 주로 수동 해석이나 정량 비교 방식에 집중해왔다. 그러나 이러한 방식은 초음파 가공과 같이 방대한 음향방출 데이터가 발생하는 실시간 모니터링과 상태 분류에 한계가 있기 때문에 머신러닝 기반의 접근이 주목받고 있다. 머신러닝을 활용한 연구가 점차 확대되고 있지만, SiC 캐소드 초음파 가공 환경에서 음향방출 신호를 적용한 연구는 여전히 부족한 실정이다.
이에 본 연구에서는 통계적 및 주파수 기반 분석을 통해 음향방출 신호의 특성을 정량적으로 파악하고자 하였으나, 작동 상태간의 중첩과 비선형성으로 인해 한계가 존재하였다. 이를 보완하기 위해 머신러닝 기법을 적용하여 상태 분류 성능을 평가하고, 실시간 공정 모니터링의 신뢰성을 향상시킬 수 있는 방안을 제시한다. 실험은 실제 공장 환경을 모사하여 다수의 초음파 가공장비를 가동한 상태에서 수행되었으며, 센서 부착 위치별 신호감지 성능을 비교하여 상태 분류에 미치는 영향을 분석하였다. 본 연구에서는 파형, 히트 데이터 기반의 머신러닝 분류 기법을 적용하여 초음파 가공 공정의 실시간 상태 모니터링 가능성을 검증하였으며, 센서 부착 위치별 신호 특성과 분류 성능 간의 관계를 정량적으로 분석하였다. 이를 통해 효과적인 공정 모니터링 체계를 구축하는 데 필요한 기초 자료를 제공하고자 한다.
2. 실험 개요
2.1 실험 장비 및 소재
본 실험에서는 SiC 캐소드 양산 공정에서 사용되는 초음파 미세 홀 가공기를 활용하여 실험을 수행하였으며, 해당 장비는
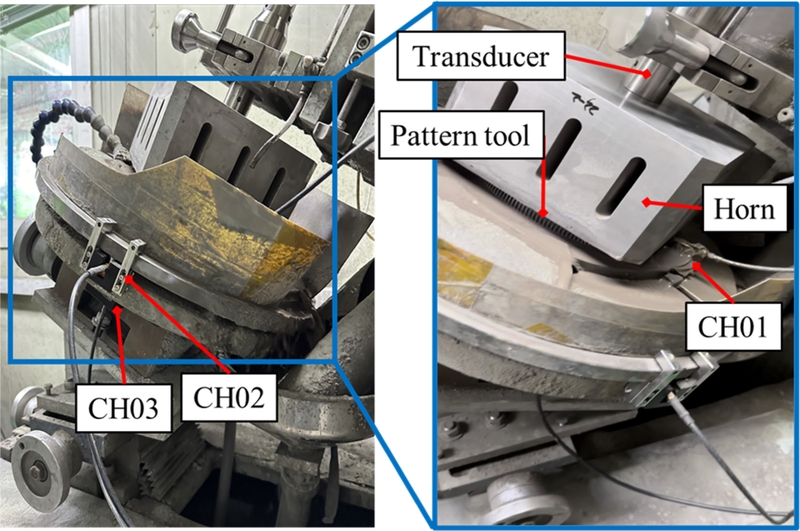
Fig. 1에 나타나 있다. 본 장비는 혼(Horn)의 자중을 이용한 중력낙하방식을 적용하며, 주요 구성 요소로 진동자(Transducer), 혼, 패턴 툴(Pattern Tool) 그리고 핀(Pin)으로 이루어져 있다. 초음파가공 중 발생하는 음향방출 신호를 수집하고 분석함으로써, 실시간 공정 모니터링과 품질 관리 가능성을 평가하고자 하였다. 진동자에서 초음파(19.8 kHz)가 생성되어 혼에 전달되며, 혼은 이 진동을 증폭시키는 역할을 한다. 패턴 툴은 가공 표면의 패턴이나 모양에 맞게 가공하는 도구이며, 핀(Ø0.45 mm)은 패턴 툴에 부착되어 소재에 구멍을 뚫는 역할을 한다. 실험에는 Ø379 mm, 두께 10 t의 상압소결 SiC 소재를 선정하였다.
Fig. 1Ultrasonic micro hole drilling machine and sensor configuration

2.2 음향방출 데이터 수집
초음파 홀 가공 실험을 진행하며 발생하는 진동 데이터를 수집하기 위해 음향방출 시스템(IDK-AES-SU8, IDK社)을 사용하였다. 음향방출 시스템은 음향방출 센서(H150), 저전압 신호를 증폭하는 프리앰프(AMP-4060), 신호를 수집·처리·저장하는 DAQ보드(DAQ8), 그리고 소프트웨어로 구성되어 있다. 실험에서는
Fig. 1과 같이 총 3개의 센서를 사용하였으며, 가공 공정에서 발생하는 신호를 효과적으로 분석하기 위해 서로 다른 위치에 부착하였다. 채널 1번은 가공 중 발생하는 원신호를 직접 수집할 수 있도록 소재에 부착하였고, 채널 2번은 가공 장비의 진동 영향을 반영하기 위해 워크 테이블 상부에 부착하였다. 마지막으로, 채널 3번은 외부 진동과 공정 잡음의 영향을 비교 분석하기 위해 워크 테이블 하부에 부착하였다.
음향방출 데이터를 수집하는 과정에서, 모든 신호를 지속적으로 저장하면 데이터 양이 과도하게 증가하여 분석 비용이 급증할 수 있다[
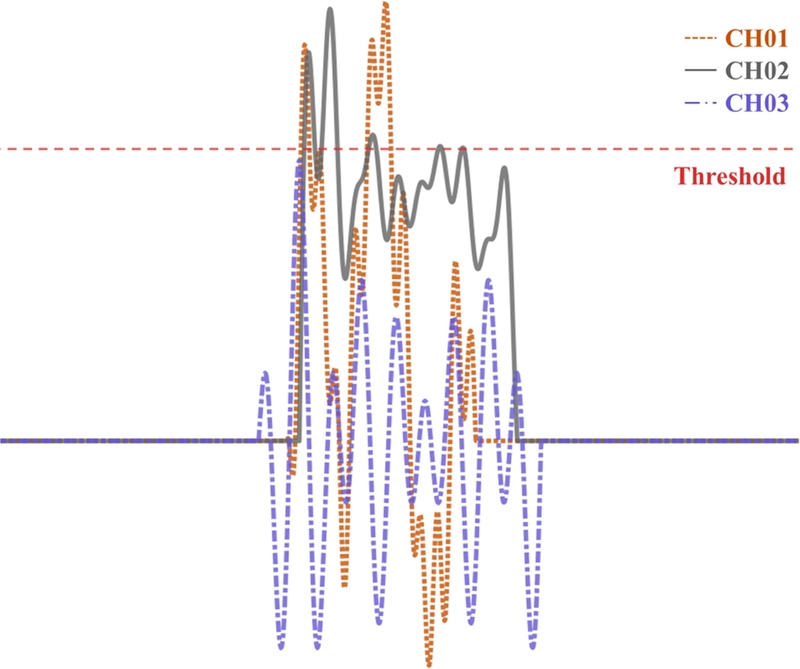
7]. 이를 방지하기 위해
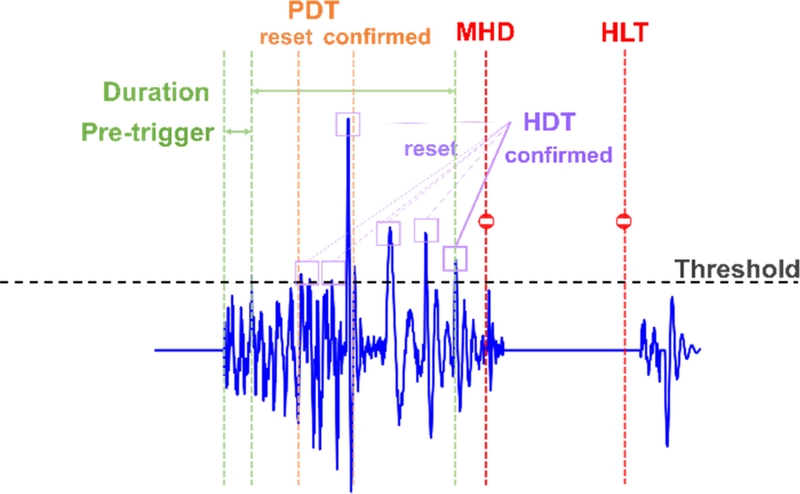
Fig. 2와 같이 일정한 임곗값을 설정한 후, 특정 진폭(Amplitude)이 임곗값을 초과한 순간부터 데이터를 수집하는 방식을 사용한다.
Table 1은 주요 파라미터를 정리한 것이다. 주요 변수로는 프리앰프의 증폭 값(Pre-amp Gain), 아날로그 신호의 샘플링 속도(Sample Rate), 데이터를 수집할 기준이 되는 임곗값(Threshold)이 포함된다. 또한, 임계값을 초과한 신호의 시작지점까지 데이터를 수집하는 Pre-trigger, 일정 시간 내 최대 진폭을 결정하는 PDT (Peak Definition Time), 데이터 수집 종료 시점을 설정하는 HDT (Hit Definition Time), 종료 후 다음 데이터 수집까지의 여유 시간인 HLT (Hit Lockout Time), 최대 데이터 수집 시간을 의미하는 MHD (Maximum Hit Duration Time) 등이 있다. 음향방출 파라미터의 기준이 되는 Threshold 값은 주위의 환경 노이즈나 가공기의 동작 노이즈를 제거할 수 있는 40 dB로 설정하였다.
Table 1AE system parameters
Table 1
|
Parameter |
Value |
Parameter |
Value |
|
Pre-Amp gain [dB] |
40 |
PDT [µs] |
200 |
|
Sample rate [kHz] |
2,000 |
HDT [µs] |
400 |
|
Threshold [dB] |
40 |
HLT [µs] |
4,000 |
|
Pre-trigger [Samples] |
0 |
MHD [µs] |
1000 |
Fig. 2Example of AE signal acquisition triggered by threshold crossing
음향방출 시스템을 통해 수집된 데이터는 크게 파형 데이터와 히트 데이터로 구분된다. 파형 데이터는 신호의 시간적 변화를 기록하며, 히트 데이터는 임곗값을 초과한 신호 구간의 세부 정보를 포함한다.
Table 2는 히트 데이터의 주요 변수를 정리한 것이다. 주요 변수에는 임곗값을 초과한 횟수(Count), 신호의 최대 진폭(Peak Amplitude), 신호 구간의 지속 시간(Duration), RMS (Root Mean Square) 값(Signal RMS), 평균 주파수(Average Frequency), 최대 진폭 도달시간(Rise-Time), 신호의 누적 강도(Signal Strength), 누적 에너지(Signal Energy), FFT (Fast Fourier Transform) 기반의 주파수 중심값(Frequency Centroid), 최대 진폭이 발생한 주파수(Peak Frequency), FFT에서 측정된 신호의 최대 크기(Peak Magnitude) 등이 포함된다.
Table 2Key parameters of hit data
Table 2
|
Count |
Signal strength [nVs] |
|
Peak amplitude [mV] |
Signal energy [EU] |
|
Duration [μs] |
Frequency centroid [kHz] |
|
Signal RMS [mVrms] |
Peak frequency [kHz] |
|
ASL [mV] |
Peak magnitude [mV] |
|
Rise-time [μs] |
1nVs: 109Vsec
|
|
Average frequency [kHz] |
1eu: 10-14 V2sec
|
2.3 실험 방법
SiC 소재를 대상으로 30초 동안 초음파 미세 홀 가공 실험을 수행하였다.
Table 3은 초음파 미세 홀 가공기의 작동 중 발생할 수 있는 네 가지 상태를 정의한 것으로, 음향방출 신호의 특성을 분석하고 외란 신호와 유효 신호를 구분하기 위한 기준을 제공한다. 가공 상태(Machining State)는 초음파 발생기와 슬러리 펌프가 작동하며, 실제 가공이 이루어지는 상태를 의미한다. 미가공 상태(Non-Machining State)는 초음파 발생기와 슬러리 펌프가 작동하고 있지만, 실제 가공이 이루어지지 않는 상태로 정의된다. 유휴 상태(Idle State)는 초음파 발생기만 작동하는 상태로, 슬러리 펌프와 가공이 중단된 상태를 의미한다. 미작동 상태(Power-off State)는 초음파 발생기, 슬러리 펌프, 가공 장치 등 모든 장치가 작동을 멈춘 상태를 의미한다.
Table 3Operating states classification for ultrasonic micro hole drilling process
Table 3
|
Classification |
Description |
|
Machining |
Slurry |
Power |
|
Machining state |
O |
O |
O |
|
Non-machining state |
X |
O |
O |
|
Idle state |
X |
X |
O |
|
Power-off state |
X |
X |
X |
본 연구에서는 가공 시스템이 안정적으로 작동하는 상태에서 운전 조건의 영향을 분석하기 위해, 50% 가공이 완료된 시점부터 실험을 수행하였다. 또한, 실제 캐소드 생산 공정 환경을 반영하기 위해 다른 초음파 미세 홀 가공기가 동시에 작동하는 상태에서 실험을 수행하였다. 이를 통해 실험 결과의 현실적 적용 가능성을 높이고, 다양한 공정 조건에서의 신호 특성을 반영하고자 하였다.
3. 실험 결과 및 분석
3.1 초음파 미세 홀 가공 실험 결과
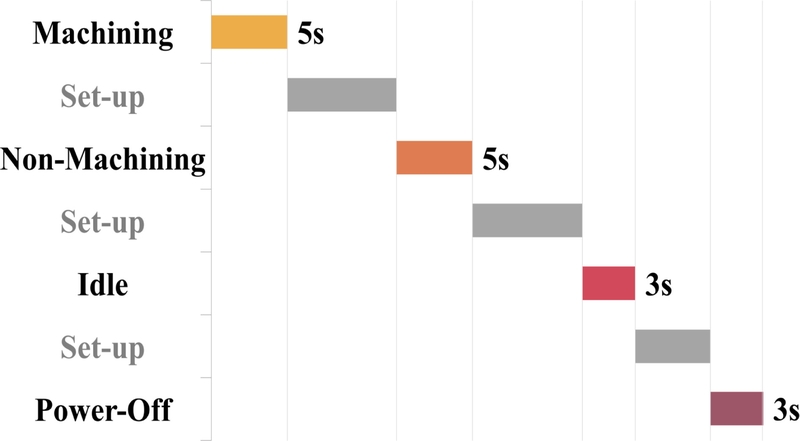
실험 결과,
Fig. 3과 같이 작동 상태 전환 시 발생하는 셋업 시간을 제외하고, 최종적으로 가공 상태 5초, 미가공 상태 5초, 유휴 상태 3초, 미작동 상태 3초의 데이터를 확보하였다. 상태 간 데이터 비교를 위해 모든 채널에서 동시 수집된 데이터를 기준으로 분석을 진행하였다.
Fig. 3State transitions and data collection durations
가공 상태에서는 대부분의 신호가 임곗값을 초과하여 세 개의 채널 모두에서 데이터를 안정적으로 수집할 수 있었다. 반면, 나머지 세 가지 상태에서는 신호의 진폭이 전반적으로 낮았으며, 특히 채널 3번에서는
Fig. 4와 같이 임곗값을 초과하지 못해 데이터가 누락되는 경우가 빈번하였다. 이러한 경우 동시간 비교가 불가능하므로 해당 데이터를 모두 제외하였다. 16초의 데이터 중 4.78%가 제외되었으며, 이는 상태 간 신호 비교의 정확성을 보장하기 위한 조치이다.
Fig. 4Threshold exceedance and data availability across three channels
3.2 파형(Waveform) 데이터 분석
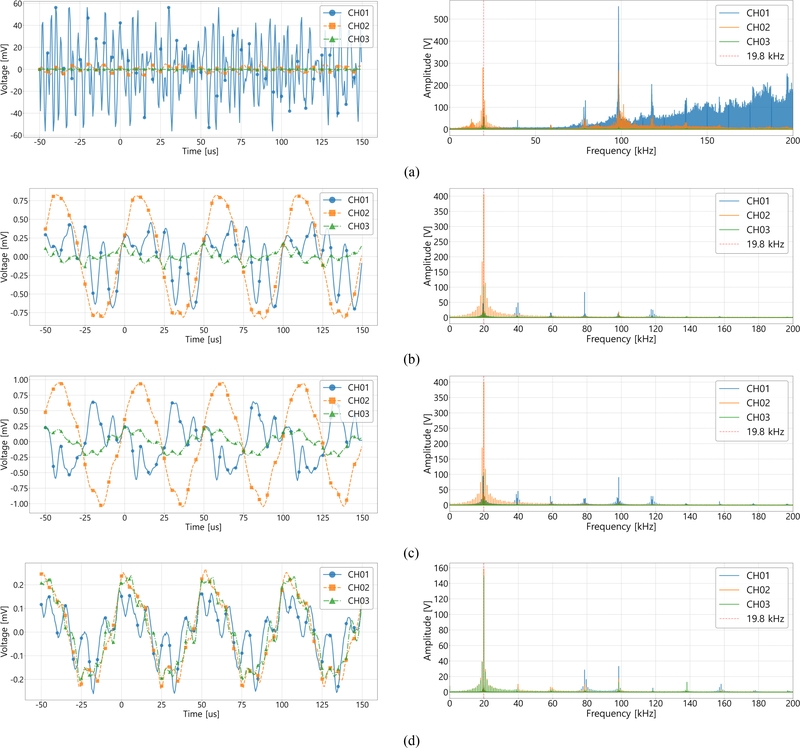
Fig. 5는 4가지 작동 상태에서 수집된 파형 데이터와 누적 FFT 데이터를 나타낸다.
Fig. 5(a) 가공 상태에서는 높은 진폭과 불규칙적인 진동이 관찰되었으며, 채널 1번에서는 ±60 mV 수준의 높은 진폭이 나타났다. 이는 수천 개의 핀이 상하로 진동하며 소재를 가공하는 과정에서 발생한 강한 충격과 진동의 영향을 받은 결과로 해석된다. FFT 분석 결과에서도 19.8 kHz를 중심으로 광범위한 신호 분포를 보였으며, 특히 150 kHz 이상까지 뚜렷한 주파수 성분이 확인되었다. 이는 가공기 진동자가 생성한 초음파와 핀-소재 간의 상호작용에서 기인한 것으로 해석된다.
Fig. 5Waveform and fft data for different operating states: (a) Machining state, (b) Non-machining state, (c) Idle state, and (d) Power-off state

반면,
Fig. 5(b) 미가공 상태에서는 ±1.0 mV 이하의 낮은 진폭과 주기적인 패턴이 관찰되었으며, 슬러리 펌프 및 가공기 진동의 영향을 받은 것으로 분석된다. FFT 분석에서는 단조로운 신호 패턴이 나타났으며, 19.8 kHz에서 채널 1번의 진폭은 가공 상태 대비 절반 이상 감소했으나, 채널 2번과 3번에서는 오히려 증가하는 경향을 보였다. 이는 핀이 소재와 접촉하지 않아 초음파 에너지가 소재 내부로 전달되지 못하고 외부로 분산된 결과로 해석된다.
Fig. 5(c) 유휴 상태에서는 미가공 상태와 유사한 신호 패턴을 보였으나, 슬러리 펌프의 영향이 적어 보다 안정적인 신호가 관찰되었다. FFT 분석 결과, 채널 1번에서 19.8 kHz의 5배 조화파에서 진폭 증가가 확인되었으며, 이는 초음파 발생기의 작동으로 인한 에너지 잔향 효과로 해석된다.
Fig. 5(d) 미작동 상태에서는 전체적으로 진폭이 낮게 나타났으며, 주변 환경에서 발생한 잡음이 포함된 신호가 수집되었다. FFT 분석 결과, 19.8 kHz에서 채널 1번과 2번의 진폭이 2배 이상 감소하였으나, 채널 3번에서는 인근 가공기에서 전달된 신호로 인해 증가하는 현상으로 추정된다. 이는 외부 가공기의 영향으로 인해 채널 3번에서 공진 현상이 발생했음을 의미한다.
결론적으로, 파형 데이터와 FFT 분석 결과를 통해 각 작동 상태에서 음향방출 신호의 뚜렷한 차이를 확인할 수 있었다. 가공 상태에서 신호는 높은 진폭과 변동성을 보였으며, 다른 상태에서는 상대적으로 낮은 진폭과 단조로운 주파수 분포를 나타냈다. 이러한 결과는 음향방출 신호를 활용하여 공정 상태를 구분하고, 외란 신호와 유효 신호를 구별할 수 있는 근거 자료로 활용될 수 있음을 시사한다.
3.3 히트 데이터 분석
히트 데이터는 음향방출 신호의 주요 특징을 파악하기 위한 데이터로, 각 작동 상태에서 수집된 데이터를 기반으로 분석하였다.
Table 4는 작동 상태별 및 채널별 주요 변수의 평균과 표준편차를 정리한 것이다. 이를 통해 신호의 크기와 주파수 특성이 작동 상태에 따라 어떻게 변하는지를 정량적으로 비교할 수 있다.
Fig. 6은 채널 별 4가지 작동 상태에 대해 가장 큰 차이를 보이는 2개의 변수를 선정하여 박스 플롯(Box Plot)으로 나타낸 것이다. 박스 플롯은 데이터의 분포, 중심 경향, 이상치를 시각적으로 표현한 도구로, 상태별 음향방출 신호의 차이를 비교하는 데 활용되었다.
Table 4Statistical Summary of acoustic emission features across operating states and channels
Table 4
|
Variable |
State |
CH01 |
CH02 |
CH03 |
|
Peak amplitude [mV] |
Machining |
99.98 ± 0.37 |
14.16 ± 2.16 |
0.61 ± 0.13 |
|
Non-machining |
1.07 ± 0.22 |
1.60 ± 0.31 |
0.60 ± 0.21 |
|
Idle |
1.38 ± 0.26 |
1.72 ± 0.45 |
0.57 ± 0.20 |
|
Power-off |
0.42 ± 0.05 |
0.62 ± 0.12 |
0.59 ± 0.14 |
|
Signal RMS [mVrms] |
Machining |
43.38 ± 1.35 |
4.92 ± 0.44 |
0.25 ± 0.07 |
|
Non-machining |
0.64 ± 0.11 |
1.06 ± 0.22 |
0.35 ± 0.14 |
|
Idle |
0.60 ± 0.09 |
1.13 ± 0.32 |
0.32 ± 0.14 |
|
Power-off |
0.22 ± 0.03 |
0.39 ± 0.09 |
0.36 ± 0.09 |
|
Frequency centroid [kHz] |
Machining |
348.96 ± 3.83 |
187.24 ± 5.22 |
152.54 ± 12.02 |
|
Non-machining |
112.56 ± 8.46 |
82.74 ± 10.08 |
152.06 ± 28.71 |
|
Idle |
120.32 ± 8.13 |
82.55 ± 15.93 |
159.15 ± 28.00 |
|
Power-off |
178.23 ± 9.29 |
140.04 ± 15.47 |
151.68 ± 20.93 |
|
Signal strength [nVs] |
Machining |
35050.92 ± 1201.98 |
3934.66 ± 359.05 |
198.92 ± 62.62 |
|
Non-machining |
522.70 ± 92.63 |
922.65 ± 188.21 |
292.54 ± 134.23 |
|
Idle |
496.80 ± 71.91 |
976.32 ± 279.88 |
270.45 ± 127.45 |
|
Power-off |
176.84 ± 34.67 |
341.15 ± 78.35 |
307.48 ± 83.68 |
Fig. 6Box plots of key parameters from hit data for operating states: (a) CH01, (b) CH02, and (c) CH03
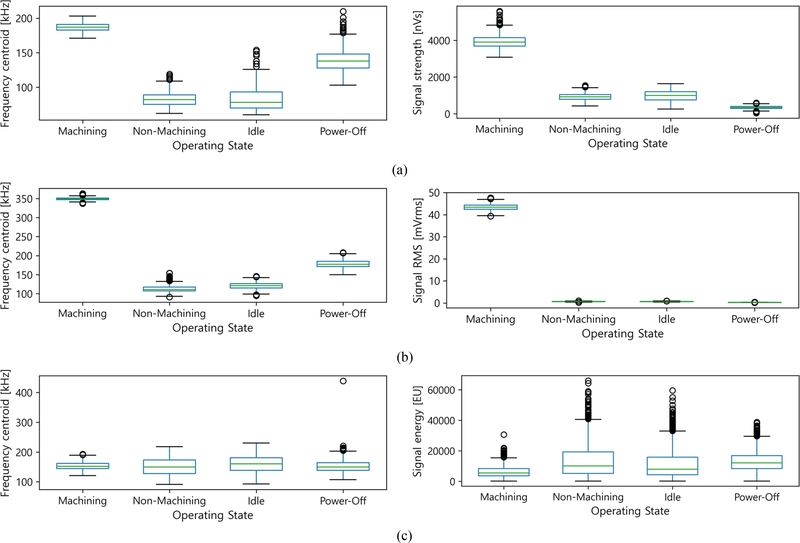
히트 데이터 분석 결과,
Table 4와
Fig. 6에서 공통적으로 가공 상태에서 높은 진폭과 신호 강도가 관찰되었으며, 이는 가공과정에서 발생하는 강한 충격과 진동으로 인해 높은 진폭과 에너지가 생성된 결과로 해석된다. 반면, 미작동 상태에서는 모든 변수에서 낮은 값을 보였으며, 신호 진폭이 낮고 변동성이 거의 없어 안정적인 신호 특성을 나타냈다. 미가공 상태와 유휴 상태는 대부분의 변수에서 유사한 값을 보였기 때문에 두 상태를 명확히 구분하는 것이 쉽지 않았다.
채널별로 살펴보면, 채널 1번과 2번에서는 가공 상태에서의 측정값이 다른 작동 상태보다 월등히 높아, 상태 구분에 효과적이었다. 채널 1번에서는 진폭 및 신호 강도의 변동성이 크고 이상치가 다수 관찰되었으며, 이는 소재와 직접 접촉한 위치에서 발생하는 불규칙한 진동과 충격 때문으로 분석된다.
반면, 채널 2번에서는 상대적으로 신호 변동성이 적고 안정적인 분포를 보였으며, 가공 상태에서도 일정한 수준의 신호 강도를 유지하는 경향이 나타났다. 채널 3번은 전반적으로 신호의 분포가 좁고 변동성이 낮아, 다른 채널보다 미가공 상태와 유휴 상태를 구분하는 것이 어려웠다. 이는 채널 3번이 다른 채널에 비해 진동 영향을 적게 받는 위치에 설치되었기 때문으로 판단된다.
수치 분석과 박스 플롯 분석 결과를 종합적으로 고려했을 때, 작동 상태 간 신호 특성의 차이는 대체적으로 명확했으나, 일부 상태(미가공, 유휴) 간 데이터가 중첩되어 단순한 통계적 방법만으로는 구분이 어려웠다. 따라서, 보다 정교한 상태 구분을 위해 머신러닝 기법을 활용할 필요성이 제기된다.
4. 음향방출 데이터의 머신러닝 기반 상태 분류
4.1 머신러닝 기반 상태 분류 모델 개요
본 연구에서는 머신러닝 기법을 활용하여 상태 분류 모델을 구축하고, 다양한 센서 부착 위치에서의 성능을 비교하여 신호 분류 성능에 미치는 영향을 분석하였다. 음향방출 데이터는 신호 중첩, 비선형적 특성, 다차원적 신호 변동 등 복잡한 특성을 포함하고 있어, 단순한 통계적 접근법만으로는 데이터의 특성을 충분히 반영하기 어렵다. 이에 따라 선형 및 비선형 모델을 적용하여 상태 분류 성능을 비교하고, 센서 부착 위치별 모델 성능 차이를 분석하여 최적의 모델과 센서 부착 위치를 선정하였다.
4.2 모델 선정 및 학습방법
기존의 연구에서도 음향방출 신호 분석을 위해 다양한 머신러닝 기법이 활용되었으며, 특히 음향방출 신호의 비선형적 특성 및 다차원적 변동을 효과적으로 학습하기 위해 선형 및 비선형 모델이 모두 활용되었다[
13]. 최근 음향방출 신호 분석에 사용된 머신러닝 기법을 살펴보면, 선형 모델로는 로지스틱 회귀 (Logistic Regression, LR) [
14,
15], 선형 SVM (Linear SVM)이 사용되었으며[
16], 비선형 모델로는 비선형 SVM (Non-linear SVM) [
17], K-최근접 이웃(K-nearest Neighbors, KNN) [
18,
19], 다층 퍼셉트론(Multi-layer PERCEPTRON) [
20], XGBoost (Extreme Gradient Boosting, XGB) [
21] 등이 활용되었다. 이러한 연구들은 음향방출 기반 결함 탐지, 구조물 상태 평가, 의료 신호 분석 등 다양한 분야에서 해당 머신러닝 모델들이 효과적으로 적용됨을 보여주었다. 이에 본 연구에서는 기존 연구에서 신뢰성이 검증된 모델들(LR, Non-linear SVM, KNN, MLP, XGB)을 적용하여 상태 분류 모델을 구축하고, 모델별 성능을 비교함으로써 적절한 알고리즘 선정하며, 센서 부착 위치가 신호 분류에 미치는 영향을 분석하고자 한다.
모델의 성능을 비교하기 위해 K겹 교차 검증(K-Fold Cross Validation, K = 5)을 수행하였으며, 분류 정확도(Accuracy)와 F1-score를 기준으로 평가하였다. 학습 데이터와 테스트 데이터를 8 : 2 비율로 분할한 후, 변수 간 차이를 줄이기 위해 정규화(Normalization)를 적용하였다. 또한, 모델 성능을 향상시키기 위해 하이퍼 파라미터 최적화 과정을 거쳤다. 모델 학습 시 사용된 변수로는 Count, Peak Amplitude, Duration, Signal RMS 등이 있다.
4.3 성능 평가 및 결과 분석
Table 5의 모델 성능 비교 결과, XGB 모델이 모든 채널에서 가장 높은 정확도와 F1-score를 기록하였으며, 특히 채널 2번에서 98.35%의 정확도를 나타내어 우수한 성능을 보였다. 반면, KNN과 LR은 상대적으로 낮은 정확도를 보였으며, 채널 3번에서 가장 낮은 성능을 기록하였다.
Table 5Comparison of machine learning models for hit data
Table 5
|
Channel |
Model |
Accuracy [%] |
F1-Score [%] |
|
CH01 |
XGB |
87.63 |
87.32 |
|
KNN |
85.87 |
85.57 |
|
LR |
85.98 |
84.91 |
|
MLP |
85.04 |
83.86 |
|
SVM |
87.04 |
86.20 |
|
CH02 |
XGB |
98.35 |
98.35 |
|
KNN |
90.11 |
90.12 |
|
LR |
92.58 |
92.48 |
|
MLP |
97.76 |
97.77 |
|
SVM |
94.70 |
94.67 |
|
CH03 |
XGB |
79.15 |
78.64 |
|
KNN |
67.02 |
65.89 |
|
LR |
73.73 |
69.62 |
|
MLP |
71.02 |
67.57 |
|
SVM |
78.09 |
75.46 |
이러한 모델별 성능 차이는 채널별 데이터 특성과 밀접한 관련이 있는 것으로 판단된다. 채널 2번에서 모든 모델의 성능이 상대적으로 높게 나타난 것은 다른 채널에 비해 잡음이 적고 신호의 변동성이 일정하기 때문으로 분석된다. 이를 종합하면, 음향방출 데이터는 일부 선형적 패턴을 보이기도 하지만, 센서 부착 위치에 따라 신호 패턴이 달라지면서 비선형성이 증가할 수 있다. 따라서 음향방출 데이터의 특성(비선형성, 주요 변수의 데이터 분포, 클래스 간 경계 등)에 따라 적절한 분류 모델을 선택하는 것이 중요하다. 본 연구 결과, 트리 기반 모델(XGB)은 신호 중첩이 많은 환경에서도 안정적인 성능을 보였으며, 이는 비선형적 패턴을 효과적으로 학습할 수 있기 때문으로 판단된다.
4.4 추가 실험 및 검증
추가 실험은 기존 실험과 동일한 환경에서 데이터를 수집하여, 센서 부착 위치가 신호 분류 성능에 미치는 영향을 재확인하고 앞선 실험 결과를 검증하는 데 목적을 두었다. 이를 위해 가공 상태 10초, 미가공 상태 5초, 유휴 상태 4초, 미작동 상태 3초 동안 초음파 미세 홀 가공기를 작동하였으며, 기존 실험과 동일한 방식으로 데이터를 처리하고 XGB를 적용하여 분석하였다.
Table 6과 같이 추가 실험에서도 채널 2번이 가장 높은 신호 분류 성능을 보였으며, 기존 실험 결과와 일관된 경향을 유지하였다. 특히, 채널 2번의 분류 정확도는 98.67%로 기존 실험과 유사한 수준을 기록하였으며, 이는 해당 채널에서 수집된 데이터가 안정적인 패턴을 형성하여 모델 성능이 일관될 가능성이 높음을 시사한다. 각 채널별 성능 비교 결과, 채널 2번(98.67%)이 가장 높은 정확도를 기록하였으며, 채널 1번(90.16%), 채널 3번(78.59%)이 그 뒤를 이었다. F1-Score 역시 정확도와 유사한 경향을 보였으며, 추가 실험에서도 기존 실험과 동일한 결과를 확인할 수 있었다. 이러한 결과를 종합하면, 추가 실험에서도 기존 실험과 일관된 분석 결과가 도출되었으며, 이를 통해 채널 2번이 신호 분석 및 상태 분류 성능을 극대화할 수 있는 최적의 센서 부착 위치임이 확인되었다.
Table 6Classification Performance Comparison Across Channels in the Additional Experiment
Table 6
|
CH01 |
M |
NM |
I |
O |
[%] |
|
M |
124 |
0 |
60 |
1 |
Accuracy |
|
NM |
0 |
438 |
0 |
0 |
90.16 |
|
I |
34 |
0 |
189 |
0 |
F1-Score |
|
O |
1 |
0 |
0 |
129 |
90.06 |
|
CH02 |
M |
NM |
I |
O |
[%] |
|
M |
184 |
0 |
1 |
0 |
Accuracy |
|
NM |
0 |
438 |
0 |
0 |
98.67 |
|
I |
12 |
0 |
211 |
0 |
F1-Score |
|
O |
0 |
0 |
0 |
130 |
98.67 |
|
CH03 |
M |
NM |
I |
O |
[%] |
|
M |
81 |
1 |
65 |
38 |
Accuracy |
|
NM |
1 |
430 |
7 |
0 |
78.59 |
|
I |
56 |
5 |
154 |
8 |
F1-score |
|
O |
25 |
1 |
2 |
102 |
78.31 |
5. 결론
본 연구에서는 SiC 캐소드 초음파 미세 홀 가공 공정 중 발생하는 음향방출 데이터를 수집하여, 파형 및 히트 데이터 기반의 통계적·주파수 분석을 수행하고, 센서 부착 위치에 따른 신호 특성과 상태 간 구분 가능성을 정량적으로 평가하였다. 이후, 전통적 분석 방법의 한계를 보완하고 실시간 상태 분류의 정확도를 높이기 위해 다양한 머신러닝 기법(XGB, KNN, LR, Non-linear SVM, MLP)을 적용하였으며, 분류 정확도와 F1-score를 기준으로 모델 성능을 비교·분석하였다.
모델 성능 비교 결과, XGB 모델이 모든 채널에서 가장 높은 정확도를 기록하였으며, 특히 채널 2번에서는 98.35%의 정확도를 보여 최적의 모델로 선정되었다. 반면, KNN과 Logistic Regression은 상대적으로 낮은 정확도를 보였으며, 특히 채널 3번에서의 성능이 가장 저조하였다. 이러한 성능 차이는 채널별 신호 특성과 모델의 데이터 학습 방식 차이에서 비롯된 것으로 분석된다.
추가 실험을 통해 기존 실험 결과를 검증한 결과, 채널 2번이 가장 높은 정확도를 유지하였으며, 기존 결과와 일관된 경향을 보였다. 이러한 결과는 센서 부착 위치가 머신러닝 모델의 성능에 중요한 영향을 미친다는 점을 시사하며, 워크 테이블 상부에서 수집된 데이터가 상대적으로 안정적인 신호 패턴을 형성하여 높은 분류 성능을 제공함을 확인하였다.
본 연구는 머신러닝 기법을 활용한 초음파 가공 공정의 상태 분류 및 실시간 공정 모니터링 가능성을 실험적으로 입증하였다는 점에서 의의가 있다. 특히, 트리 기반 모델(XGB)의 높은 성능은 비선형적 신호 특성을 효과적으로 학습할 수 있음을 보여주며, 신호 중첩이 많은 환경에서도 안정적인 결과를 제공할 수 있음을 시사한다.
향후 연구에서는 다양한 가공 조건에서 센서 부착 위치 변화가 머신러닝 모델 성능에 미치는 영향을 추가적으로 검토하고, 딥러닝 기반 모델과의 비교를 통해 보다 정밀한 상태 분류 및 공정 모니터링 기법을 개발할 필요가 있다. 또한, 다양한 신호 처리 기법과 결합하여 신호 품질을 향상시키고, 센서 배치 최적화 전략을 보다 정교하게 분석하는 연구가 필요하다.
ACKNOWLEDGMENTS
본 논문은 중소벤처기업부에서 지원하는 2024년도 산학연플랫폼 협력기술개발(R&D) 및 중소기업 기술혁신개발(Nos. 2420003527 and 2420000604), 산업통상자원부와 한국산업기술진흥원의 e모빌리티 전동기 재제조 산업 확산 및 실증지원 기반 구축사업(No. P0027509)으로 수행된 연구결과입니다. 연구에 도움을 주신 ㈜제이머티리얼즈에 감사드립니다.
REFERENCES
- 1.
Park, H., Lee, W., Kang, D., Park, I., Lee, J., (2017), A study on the machining characteristics of CVD-SiC, Journal of the Korean Society of Manufacturing Process Engineers, 16(5), 40-46.
10.14775/ksmpe.2017.16.5.040
- 2.
Kim, J., (2016), Application of CVD-SiC materials, Ceramist, 19(3), 14-16.
- 3.
Kang, I. H., (2023), SiC power semiconductor technology, Korea Institute of Power Electronics (KIPE), Wide Band Gap Power Semiconductor Special Issue, 1-32.
- 4.
De Zanet, A., Pedroni, M., Salvo, M., Vassallo, E., Casalegno, V, (2023), Plasma etching as a surface engineering technique for SiC/SiC composites to improve joint strength, Ceramics International, 49, 10608-10614.
10.1016/j.ceramint.2022.11.248
- 5.
Hur, C., Chae, S.-S., Lee, C.-S., Kim, T.-S., Lee, J.-C., (2007), A study on the micro hole drilling for CVD-SiC using ultra-sonic machining, Proceedings of the Korean Society for Mechanical Processing Spring Conference, 199-203.
- 6.
Nam, K.-W., Lee, K.-C., Kohyama, A., (2009), A feasibility study on the application of ultrasonic method for surface crack detection of sic/sic composite ceramics, Journal of the Korean Society for Nondestructive Testing, 29(5), 479-484.
- 7.
Kim, D., Lee, S., Park, W., (2023), Damage assessment of reinforced concrete beams under flexural failure mode using acoustic emission testing, Journal of the Korean Society of Safety, 38(2), 36-43.
- 8.
Kim, S., Park, S., Kim, K., Kim, B., Kim, W., (2024), Failure mode clustering of carbon fiber-reinforced plastics via acoustic emission testing, Journal of the Korean Society for Nondestructive Testing, 44(5), 328-335.
10.7779/JKSNT.2024.44.5.328
- 9.
Oliveira, T. L. L., Zitoune, R., Ancelotti Jr., A. C., Cunha Jr., S. S., (2020), Smart machining: Monitoring of CFRP milling using AE and IR, Composite Structures, 249, 112611.
10.1016/j.compstruct.2020.112611
- 10.
Guo, Y. B., Ammula, S. C., (2005), Real-time acoustic emission monitoring for surface damage in hard machining, International Journal of Machine Tools & Manufacture, 45(12), 1622-1627.
10.1016/j.ijmachtools.2005.02.007
- 11.
Park, K.-R., Lee, J.-J., Yu, H.-T., Moon, Y.-B., (2022), Feature analysis of acoustic emission signals for diagnosing bolt loosening in tubular transmission towers, Journal of the Korean Society for Nondestructive Testing, 32(2), 195-203.
10.5050/KSNVE.2022.32.2.195
- 12.
Muir, C., Swaminathan, B., Almansour, A., Sevener, K., Smith, C., Presby, M., Kiser, J., Pollock, T., Daly, S., (2021), Damage mechanism identification in composites via machine learning and acoustic emission, npj Computational Materials, 7(1), 95.
10.1038/s41524-021-00565-x
- 13.
Ciaburro, G., Iannace, G., (2022), Machine-learning-based methods for acoustic emission testing: A review, Applied Sciences, 12(20), 10476.
10.3390/app122010476
- 14.
Li, H., Wang, Y., Zhao, P., Zhang, X., Zhou, P., (2015), Cutting tool operational reliability prediction based on acoustic emission and logistic regression model, Journal of Intelligent Manufacturing, 26, 923-931.
10.1007/s10845-014-0941-4
- 15.
Gaja, H., Liou, F., (2018), Defect classification of laser metal deposition using logistic regression and artificial neural networks for pattern recognition, The International Journal of Advanced Manufacturing Technology, 94, 315-326.
10.1007/s00170-017-0878-9
- 16.
Dobrzycki, A., Mikulski, S., Opydo, W., (2019), Using ANN and SVM for the detection of acoustic emission signals accompanying epoxy resin electrical treeing, Applied Sciences, 9(8), 1523.
10.3390/app9081523
- 17.
Wu, Y., Li, S., (2022), Damage degree evaluation of masonry using optimized SVM-based acoustic emission monitoring and rate process theory, Measurement, 190, 110729.
10.1016/j.measurement.2022.110729
- 18.
Bui Quy, T., Muhammad, S., Kim, J. M., (2019), A reliable acoustic emission-based technique for the detection of a small leak in a pipeline system, Energies, 12(8), 1472.
10.3390/en12081472
- 19.
Olorunlambe, K. A., Hua, Z., Shepherd, D. E. T., Dearn, K. D., (2021), Towards a diagnostic tool for diagnosing joint pathologies: Supervised learning of acoustic emission signals, Sensors, 21(23), 8091.
10.3390/s21238091
- 20.
Twardowski, P., Tabaszewski, M., Wiciak-Pikuła, M., Felusiak-Czyryca, A., (2021), Identification of tool wear using acoustic emission signal and machine learning methods, Precision Engineering, 72, 738-744.
10.1016/j.precisioneng.2021.07.019
- 21.
Pandiyan, V., Wróbel, R., Leinenbach, C., Shevchik, S., (2023), Optimizing in-situ monitoring for laser powder bed fusion process: Deciphering acoustic emission and sensor sensitivity with explainable machine learning, Journal of Materials Processing Technology, 321, 118144.
10.1016/j.jmatprotec.2023.118144
Biography
- Minkeon Lee
Received the M.S. degree in the Department of Smart Manufacturing Convergence, Changwon National University and Researcher in Korea Electronics Technology Institute. His research interests include data analysis and industrial AI.
- Iljoo Jeong
Received the Ph.D. degree in the Department of Mechanical Engineering, Pohang University of Science and Technology and Senior Researcher in Korea Electronics Technology Institute. His research interests include industrial AI, AI-aided engineering, smart factory, acoustics, and inverse problem.
- Jonghyeok Chae
Ph.D. candidate in the Department of Mechanical Engineering, Pusan National University and Senior Researcher in Korea Electronics Technology Institute. His research interests include machine vision, PHM engineering.