ABSTRACT
Due to the recent 4th industrial revolution and explosive interest in smart factories, the demand for industrial robots and related technologies is rapidly increasing. In order to develop a precision reducer for robots, a measurement technology of the small teeth of a gear is very important. This paper developed a method to measure the tooth shape of a precision harmonic reducer for robots and to evaluate the tooth shape measurement error quantitatively. The tooth shape of the flexspline of a harmonic drive was measured using three instrumental devices: a stylus, a projector, and a laser line scanner. A mathematical tool was also developed to evaluate the error by comparing the designed and measured teeth. The measured tooth profile was quantitatively assessed with maximum, average, and root mean square error. The measurement method using a stylus has disadvantages of careful measurement effort and a small measuring range. However, it has better precision. On the other hand, the projection method shows a moderate performance without much effort during measurement.
-
KEYWORDS: Harmonic drive, Tooth profile, Measurement, Evaluation
-
KEYWORDS: 하모닉 드라이브, 치형, 측정, 평가
NOMENCLATURE
Distance from the jth Point of the Designed Tooth Profile to Line li
Error of the Measured Tooth Profile
Line through the ith and (i + 1)th Points of the Measured Tooth Profile
Offset Value of the Measured Tooth Profile
The ith Point of the Designed Tooth Profile
Vector Set of the Designed Tooth Profile
The jth Point of the Measured Tooth Profile
Vector Set of the Measured Tooth Profile
Distance from the ith Point of the Measured Tooth Profile to the Designed Tooth Profile
1. 서론
최근 4차 산업혁명과 스마트 팩토리에 대한 폭발적인 관심에 따라 로봇 관련 응용기술과 산업용 로봇의 수요가 빠르게 증가하고 있다. 정밀도가 요구되는 산업용 로봇에 대한 수요는 세계적으로 확대되고 있으며, 그에 따라 산업용 로봇에 적용 가능하고, 두께 대비 폭 비가 0.25 이하, 각도전달오차 1분 이하를 갖는 초정밀/초경박단소 감속기에 대한 수요도 빠르게 증가하고 있다.
1
산업용 로봇의 관절 구동부에 사용되는 정밀감속기 중 대표적인 하모닉 드라이브는 기존의 감속기와 달리 금속의 탄성 변형을 이용하여 감속을 하기 때문에 소형, 경량, 고감속기의 특징을 가진다.
2
하모닉 드라이브의 경우 일본제품이 전 세계 시장의 70%를 점유하고 있으며 고단가, 조율 불가능한 납기 등의 문제가 있다. 국내 업체에서 역설계를 기반으로 개발을 시도하고 있으나 해석 및 설계 등 원천 기술 부족으로 성능의 신뢰성을 확보하지 못하고 있다.
3
하모닉 드라이브의 개발 및 효과적인 생산을 위해 미세한 치형의 정밀한 측정 및 평가 방법이 필요하다.
4-10 하모닉 감속기는 일반 감속기에 비해 치형이 매우 작아서 치형의 정밀한 측정과 평가는 정밀 감속기의 양산 성능 신뢰성 확보를 위한 핵심기술이지만, 인디케이터 등을 사용한 일반적인 치형 측정 방법을 적용하기 어렵다.
이 논문에서는 로봇용 정밀 하모닉 감속기의 치형을 측정하고, 측정 오차를 정량적으로 평가하는 방법을 개발하였다. 먼저 스타일러스, 투영기 그리고 레이저 라인 스캐너 등의 치형 측정 장비를 이용하여 하모닉 드라이브 플렉스 스플라인(Flexspline, FS)의 치형을 측정하였다. 그리고 설계치형과 측정치형을 비교하여 오차를 정량적으로 평가하기 위한 수학적 도구를 개발하였다. 치형 측정 결과를 최대, 평균, 평균 제곱근 오차로 평가하였다. 스타일러스를 이용한 접촉 측정은 세심한 측정 노력 및 좁은 측정 범위의 단점이 있지만 상대적으로 가장 정밀한 측정이 가능했다. 반면, 투영 측정 방법은 큰 노력 없이도 적당한 측정 성능을 갖는다.
2. 미세 치형 측정 방법
2.1 측정 장비
미세 치형 측정 방법은 스타일러스를 이용한 접촉식 측정법과 투영기나 레이저 라인 스캐너를 이용하는 비접촉 측정법이 있다. 연구에 사용한 미세 치형 측정 장비를
Fig. 1에 표시하였고, 그 사양을
Table 1에 정리하였다. 기어 테스터는 스타일러스를 이용하여 치형을 접촉하여 측정하며 동심도 및 흔들림(Runout)이 0.3 μm 이하이며, 투영기는 측정 물체에 빛을 비추고, 외곽을 정밀하게 측정하며 0.1 μm의 분해능을 가진다. 레이저 라인 스캐너는 측정 물체에 직선의 레이저를 비추어 정확히 측정하며 2.5 μm의 분해능을 가진다.
Fig. 1Various devices to measure the teeth of a harmonic reducer
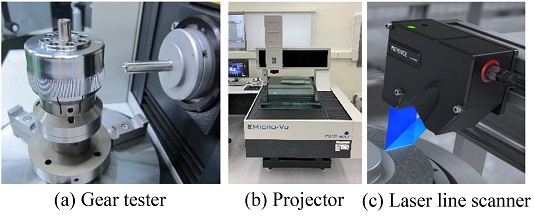
Table 1Specifications of various measuring devices11-13 (Adapted from Refs. 11 to 13 on the basis of OA)
Table 1
|
(a) Gear tester11
|
|
Measuring range (X/Z) [mm] |
±50/250 |
|
Accuracy [μm] |
1.6 + L/400 |
Resolution [μm]
(Runout/Straightness/Coaxiality) |
< 0.3/0.4/1.2 |
|
|
|
(b) Projector12
|
|
Measuring range (X/Y/Z) [mm] |
650/650/25 |
|
XY accuracy [μm] |
2.8 + L/300 |
|
Z accuracy [μm] |
3.0 + L/100 |
|
Resolution [μm] |
|
|
|
|
(c) Laser line scanner13
|
|
Measuring range (X/Z) [mm] |
7.5/20±2.2 |
|
Accuracy (Z linearity) |
±0.05% of F.S. |
|
Resolution [μm] |
2.5 |
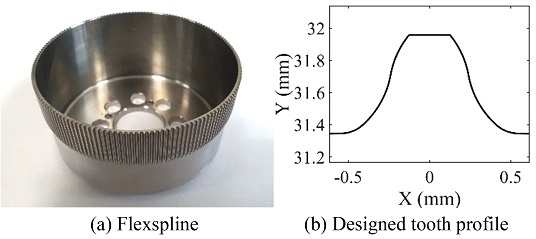
Figs. 2(a)에 하모닉 드라이브(KSH25-50)의 플렉스 스플라인 사진과 그 설계치형을
2(b)에 나타낸다. 해당 하모닉 드라이브는 정격 토크 39 Nm와 감속비 100을 가지며, 모듈은 0.65 mm, 압력각은 약 21.5
o, 치고는 약 0.77 mm이다.
Fig. 2Flexspline and its tooth profile
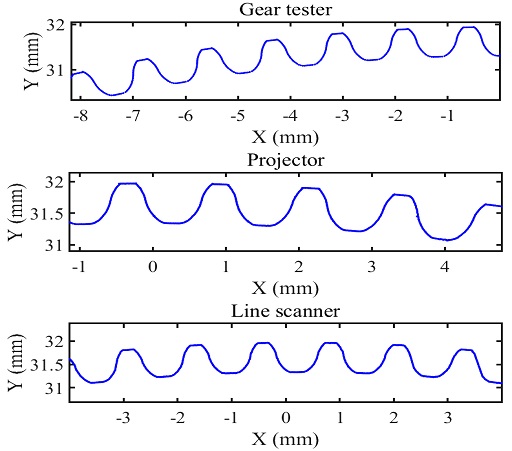
세 가지 장비로 치형을 측정하여 그 결과를
Fig. 3에 표시하였다. 평균 측정 잇수는 기어테스터 경우 5개, 투영기는 4개, 레이저 라인 스캐너는 6개이다. 각 측정 장비의 측정 구간의 평균 측정점 개수는 기어테스터, 투영기, 레이저 라인 스캐너가 각각 422, 3,108, 3,200개였다. 투영기와 레이저 라인 스캐너는 2회 측정했지만 기어테스터는 접촉 측정의 신뢰도를 고려하여 6회 측정하였다. 기어테스터로 측정한 결과 피치원 부근 압력각이 작은 구간에서 측정 오차가 보인다. 투영기로 측정한 경우 불연속 측정점과 중복점이 발생하기 때문에 측정점의 밀집도가 다르다. 반면 레이저 라인 스캐너는 3,200개로 밀집도가 일정하다. 세 가지의 장비를 서로 비교하기 위해서 투영기의 불연속 측정점과 중복점, 레이저 라인 스캐너의 높은 측정 밀도를 전처리로 보정한다.
Fig. 3Teeth measurement results of the three devices

3. 치형의 오차 평가
3.1 측정 데이터 전처리
3.1.1 투영기의 불연속 측정점과 중복점
투영기로 측정한 치형은 불연속 및 중복점을 가지고 있는데 이는 치형의 특정 구간을 2회 이상 측정하여 발생하는 것으로 보인다. 같은 좌푯값을 갖거나 같은 x값을 갖는 중복 측정점들은 x축을 기준으로 정렬 후 점 1개를 제외하고 제거하였다.
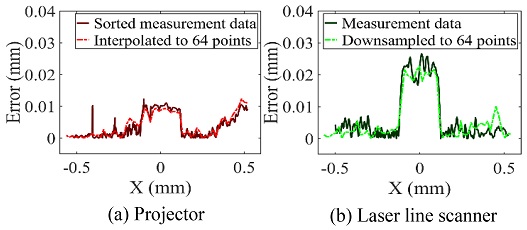
3.1.2 투영기 측정치형 보간
투영기로 측정한 경우 중복 측정점 제거 후에도 특정 구간에서는 측정점의 밀집도가 높다. 측정잡음에 강건한 PCHIP(Piecewise Cubic Hermite Interpolating Polynomial)를 사용하여 측정점이 균일한 분포를 가지도록 보간하였다.
14
투영기의 치당 평균 측정 점 개수는 557개이고, 기어테스터의 치당 평균 측정점 개수는 64개이다. 측정점 개수 감소의 영향을 살펴보기 위해 투영기의 측정점을 64의 배수인 192와 384개로 보간하여 두 측정기의 성능을 비교분석하였다.
3.1.3 레이저 라인 스캐너 측정치형 다운샘플링
레이저 라인 스캐너는 투영기와 달리 중복 측정이 없고, 균일한 분포를 갖기 때문에 보간법 대신 다운샘플링(Downsampling)을 수행하였다. 치형 오차에 대한 점 개수의 영향을 고찰하기 위해 치당 점 개수를 192, 128 그리고 64로 감소시키며 치형 오차를 분석하였다.
3.1.4 치형 정렬
측정치형의 치고를 추출하고, SVD (Singular Value Decomposition)로 PCA (Principle Component Analysis)를 수행하여 측정치형의 회전각도 계산 후 회전 변환하여 설계치형과 정합시켰다.
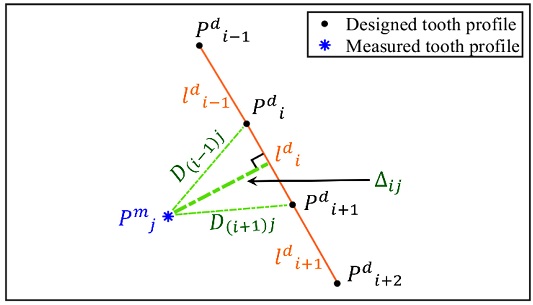
3.2 치형 오차 평가의 수학적 모델
측정치형의 한 점
Pmj로부터 설계치형까지의 최소거리는
Fig. 4에 나타냈으며 형상의 연속적인 점 2개로 이루어진 선분들 위가장 가까운 점에서까지의 거리를 오차로 정의하였다. 설계치형의 임의의 점은
Pdi이고,
q개의 점들이 있을 때 설계치형 전체 점들은
식(1)과 같이
Pd로 표현된다. 측정치형의 임의의 점은
Pmj이고,
r개의 점들이 있을 때 측정치형 전체 점들은
식(1)과 같이
Pm으로 표현된다. 설계치형의 한 점
Pdi와 다음 점
Pdi+1로 형성되는 선분
lid는
식(2)로 표현되고, 측정치형의 점
Pmj로부터 선분
lid까지의 거리
Dij는
식(3)과 같다. 최종적으로 측정치형 한 점
Pmj에서 설계치형
Pd까지의 최소거리는
식(4)와 같이 표현할 수 있다.
Fig. 4Evaluation model for deviation of a tooth profile

3.3 XY축 오프셋
측정치형의 XY 방향 오프셋을 조절하며 설계치형 대비 측정치형의 오차를
식(5)와 같이 계산한다. 측정치형과 설계치형의 오차가 최소가 되도록 측정치형의 오프셋
O(
Ox,
Oy)을 조절한다.
식(5)에서 X = 1이면 평균 오차, X = 2이면 평균 제곱근(Root Mean Square, RMS) 오차, 그리고 X = ∞이면 최대오차이다.
4. 결과
4.1 전처리 결과
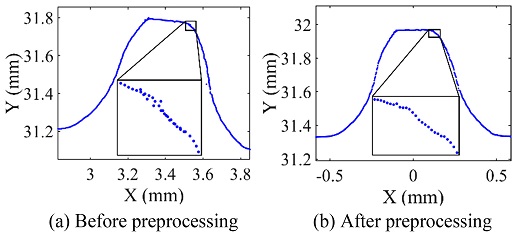
투영기의 불연속 측정점들과 중복점을 포함한 전처리 전 치형은
Fig. 5(a)와 같다. 불연속 측정점들을 정렬, 중복 측정점 제거, 보간법을 통한 측정점 밀도 균일화, 회전 변환 등의 전처리 결과를
Fig. 5(b)에 나타냈다. 기어테스터는 회전변환만 수행하고, 레이저 라인 스캐너는 회전 변환과 다운샘플링을 수행하였다.
Fig. 5Preprocessing of the measured tooth profile
4.2 측정 오차 비교
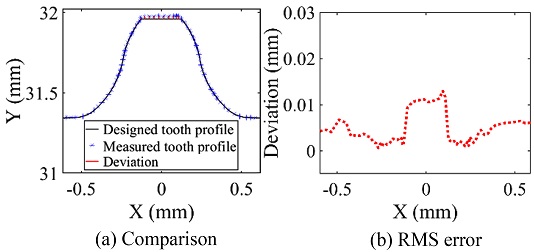
4.2.1 오프셋 후 오차거리
최대, 평균, 평균 제곱근 오차가 가장 작은 오프셋 위치에서 치형의 오차를 각각 계산하였고, 기어테스터의 RMS 오차가 최소가 되는 결과를
Fig. 6에 나타냈다.
Fig. 6RMS error of the measured tooth profile with the gear tester

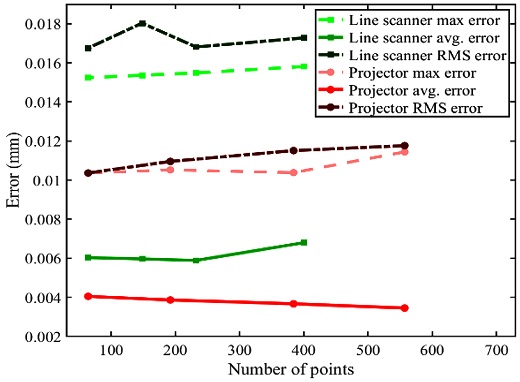
4.2.2 점 개수에 따른 측정 오차 비교
투영기, 레이저 라인 스캐너 그리고 기어테스터는 치형당 측정점 개수가 큰 차이가 있다. 치형 오차에 대한 측정점 개수의 영향을 살펴보기 위해 보간과 다운샘플링으로 치형당 측정점 개수를 변경하며 오차를 계산하여
Fig. 7과
Table 2에 나타낸다. 투영기는 치형당 557(원본), 384, 192, 64개, 레이저 라인 스캐너는 치형당 400(원본), 232, 148, 64개의 측정점을 사용하였다. 투영기와 라인 스캐너의 치형당 측정점 개수 변경 전후의 치형 오차
Fig. 8에 나타낸다. 점 개수 감소의 영향은 약 2-12% 정도였다.
Fig. 7Error with various number of the measured points

Table 2Error before and after reducing the number of points
Table 2
|
# of pts. |
Max [μm] |
Average [μm] |
RMS [μm] |
|
Projector |
557 |
11.441 |
3.4537 |
11.762 |
|
384 |
10.381 |
3.6714 |
11.508 |
|
192 |
10.520 |
3.8671 |
10.954 |
|
64 |
10.359 |
4.0517 |
10.365 |
|
Line scanner |
400 |
15.808 |
6.7977 |
17.271 |
|
232 |
15.481 |
5.8897 |
16.810 |
|
148 |
15.361 |
5.9666 |
18.027 |
|
64 |
15.240 |
6.0325 |
16.750 |
Fig. 8Error before and after reducing the number of points
4.2.3 기어테스터의 축 방향에 따른 측정 오차
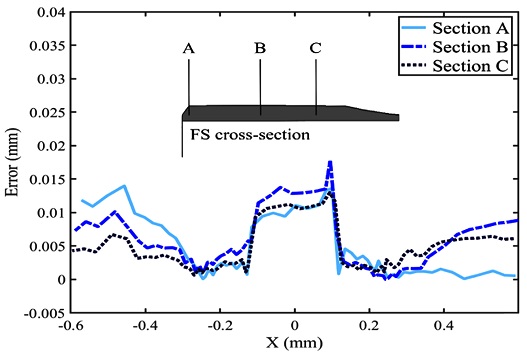
기어테스터는 축 방향 위치에 따른 측정이 가능하며 플렉스 스플라인의 축 방향 위치(A, B, C)에 따라 오차가 변할 수 있기 때문에 오차를
Fig. 9에 표시하였고, 가장 안쪽인 C에서 가장 적은 오차를 가진다.
Fig. 9Error of the three sections measured with the gear tester

4.2.4 각 측정기의 측정 오차 비교
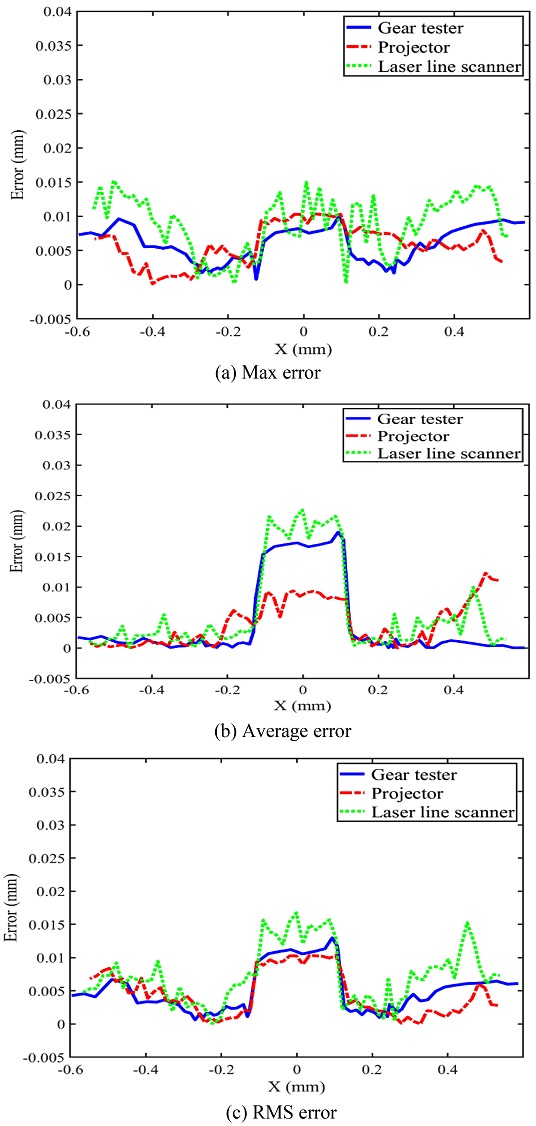
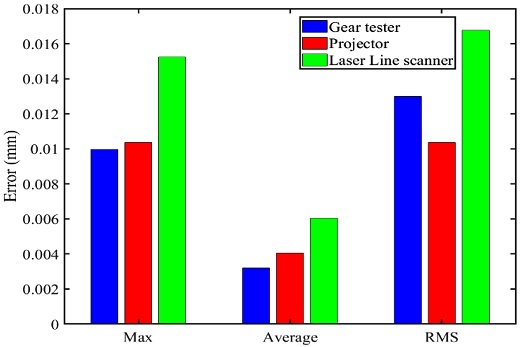
기어테스터(각 최대, 평균, 평균 제곱근 오차가 가장 작은 C구간), 투영기 그리고 레이저 라인 스캐너의 치형 오차를
Figs. 10,
11과
Table 3에 나타낸다. 기어테스터는 최대 및 평균 오차가 가장 작았고, 투영기는 평균 제곱근 오차가 최소였다. 하모닉 드라이브는 치고를 조절하여 3차원 물림을 보장하기 때문에 치고에서 설계치형과의 오차가 가장 컸다. 기어테스터의 경우 치근 부근의 측정 오차가 다른 측정 장비에 비해 작았다. 투영기의 경우 RMS 오차를 제외하고, 기어테스터보다 모든 오차가 컸다. 반면 레이저 라인 스캐너는 전 구간에서 오차가 비교적 불규칙적이고, 가장 큰 오차를 보였다. 투영기의 경우 레이저 라인 스캐너와 비교할 때 최대오차, 평균오차, RMS 오차는 순차적으로 약 32, 33, 38% 작았고, 기어테스터와 비교하면 최대와 평균오차는 각각 4와 26% 크고, RMS 오차는 약 20% 작았다.
Fig. 10Tooth profile measurement errors of the three devices

Fig. 11Error comparison of the three measurement devices

Table 3Error comparison of the three measurement devices
Table 3
|
Device (64pts.) |
Max [μm] |
Average [μm] |
RMS [μm] |
|
Gear tester |
9.958 |
3.205 |
12.980 |
|
Projector |
10.359 |
4.052 |
10.365 |
|
Laser line scanner |
15.240 |
6.033 |
16.750 |
5. 결론
이 논문은 로봇용 정밀 하모닉 감속기의 치형을 측정하고, 치형 측정 오차를 정량적으로 평가하는 방법을 개발하였다. 스타일러스, 투영기 그리고 레이저 라인 스캐너 등의 측정 장비를 이용하여 하모닉 드라이브 플렉스 스플라인의 치형을 측정하였다. 설계치형과 측정치형을 비교하여 오차를 정량적으로 평가하기 위한 수학적 도구를 개발하였다. 측정 결과를 최대, 평균, 평균 제곱근 오차로 평가하였다. 기어테스터를 이용한 측정 방법은 세심한 측정 노력 및 작은 측정 범위의 단점이 있지만 상대적으로 정밀한 측정이 가능하다. 반면, 투영 측정 방법은 큰 노력 없이 우수한 측정 성능을 보인다.
ACKNOWLEDGMENTS
이 연구는 2020년 산업통상자원부 기계산업핵심기술개발사업의 지원으로 수행되었음(No. 20011879).
REFERENCES
- 1.
Pham, A. -D. and Ahn, H. -J., “High Precision Reducers for Industrial Robots Driving 4th Industrial Revolution: State of Arts, Analysis, Design, Performance Evaluation and Perspective,” International Journal of Precision Engineering and Manufacturing-Green Technology, Vol. 5, No. 4, pp. 519-533, 2018.
10.1007/s40684-018-0058-x
- 2.
- 3.
Ahn, H. -J., Choi, M., Kim, B. S., and Jin, S. H., “Design Program of Gear Tooth of a Harmonic Drive,” Proc. of the KSPE Conference, pp. 33-34, 2020.
- 4.
Younes, M., Khalil, A. M., and Damir, M., “Automatic Measurement of Spur Gear Dimensions Using Laser Light, Part 2: Measurement of Flank Profile,” Optical Engineering, Vol. 44, No. 10, Paper No. 103603, 2005.
- 5.
Luo, M. and Zhong, S., “Non-Contact Measurement of Small-Module Gears Using Optical Coherence Tomography,” Applied Sciences, Vol. 8, No. 12, Paper No. 2490, 2018.
10.3390/app8122490
- 6.
Pillarz, M., von Freyberg, A., and Fischer, A., “Gear Shape Parameter Measurement Using a Model-Based Scanning Multi-Distance Measurement Approach,” Sensors, Vol. 20, No. 14, Paper No. 3910, 2020.
10.3390/s20143910
- 7.
- 8.
Tian, H., Wu, F., and Gong, Y., “Gear Tooth Profile Reconstruction via Geometrically Compensated Laser Triangulation Measurements,” Sensors, Vol. 19, No. 7, Paper No. 1589, 2019.
10.3390/s19071589
- 9.
- 10.
- 11.
- 12.
- 13.
- 14.
Biography
- Min Choi
Undergraduate Student in the Department of Mechanical Engineering, Soongsil University. His research interest is in mechatronics, actuators, control and precision machine design.
- Hyeong-Joon Ahn
He received B.S., M.S. and Ph.D. degrees from Seoul National University, Korea in 1995, 1997 and 2001, respectively. He was research associate in University of Virginia, 2002 and is currently a professor at School of Mechanical Eng., Soongsil University. Dr. Ahn’s research interests are in the area of mechatronics, sensors, actuators, control and precision machine design.
Citations
Citations to this article as recorded by

- The Prediction of the Angular Transmission Error of a Harmonic Drive by Measuring Noncontact Tooth Profile and Considering Three-dimensional Tooth Engagement
Beom-Seok Kim, Seung-Tae Jeong, Hyeong-Joon Ahn
International Journal of Precision Engineering and Manufacturing.2023; 24(3): 371. CrossRef