ABSTRACT
Alcohol acts as a central nervous system depressant and is classified as a psychoactive drug that impairs cognitive alertness and motor coordination. Driving after alcohol consumption slows reaction time in emergency situations and increases the risk of collisions. Although various technologies have been developed to measure alcohol concentration, many suffer from limitations such as sensitivity to environmental factors (e.g., temperature and humidity), hygiene concerns, and the need for periodic calibration. This study proposes an optical method for measuring alcohol concentration using near-infrared (NIR) spectroscopy. Statistical analyses were conducted across multiple wavelength regions to identify wavelengths with significant correlations to alcohol concentration. As a preliminary step, single alcohol solution samples were prepared using distilled water and ethanol. The optical properties of the samples were analyzed in the NIR wavelength range, and statistical indicators including the coefficient of determination (R²), p-value, and coefficient of variation (CV) were evaluated. The results identified specific wavelengths with statistical significance, and the application of mathematical modeling at these wavelengths enabled accurate estimation of alcohol concentration. This approach demonstrates the potential for non-invasive alcohol concentration measurement while minimizing hygiene and infection-related concerns for users.
-
KEYWORDS: Non-invasive sensing, Alcohol concentration, Multi-wavelength, Measurement
-
KEYWORDS: 비침습적 센싱, 알코올 농도, 다중파장, 측정
1. 서론
알코올은 중추신경계를 억제하여 인지 기능, 반사 신경, 근육 협응 능력을 저하하는 물질 중 하나이다[
1,
2]. 또한 이에 따라 교통, 산업, 항공, 군사, 의료 등 다양한 분야에서 심각한 안전사고를 유발할 수 있다[
3-
11]. 실제로 음주로 인한 사고는 교통사고뿐만 아니라 산업재해, 작업장 부상, 의료사고 등 다수의 분야에서 높은 비중을 차지하며, 이는 인명 피해만 아니라 생산성 저하와 막대한 사회·경제적 손실로 이어진다. 따라서 특정 상황 이후의 사후 측정이 아닌, 위험 작업이나 운전, 기계 조작 전 단계에서 신속하고 정확한 비침습적인 알코올 측정 기술이 요구되어진다.
기존의 호기 측정, 공기 감지, 채혈 측정 기술은 위생 문제, 외부 요인 민감성, 즉시성 부족 등으로 인해 다양한 산업 환경에 적용하는 데 한계가 있다[
12-
14]. 또한 기존 알코올 농도 측정 연구도 정확성과 민감도가 외부 요인의 영향을 받거나, 주기적인 보정이나 교체가 필요한 등의 문제점들이 존재한다[
15-
18].
이에 본 연구는 근적외선(NIR) 파장 영역의 광학 측정 기법을 활용하여 생체에서 반사된 광신호를 분석함으로써 실시간· 비침습·위생적인 알코올 측정 기술을 개발하고자 한다. 다중 통계 지표를 이용한 최적 파장 도출과 수학적 모델링을 통해 정확성과 신뢰성을 향상시키며, 이를 폭 넓게 다양한 산업 분야에 적용할 수 있는 기반 기술로 발전시키는 것을 목표로 한다. 본 연구에서는 NIR 파장 영역에서 정확도 높은 혈중알코올 농도 측정 기술을 개발하고자 하며, 다중 통계 지표를 활용한 최적 파장 선정 방법을 제안하여 측정의 정확성과 신뢰성을 향상시키고자 한다. 이를 통해 음주로 인하여 발생 가능한 사고를 사전 방지함으로써 사회적 피해를 감소시키고, 직접적인 혈중 알코올농도를 더 간편하고 정확성 높은 측정 기술에 적용하고자 한다.
2. 실험 셋업 및 방법
2.1 생체물질의 광학적 측정 원리
빛이 생체에 조사되면 생체 물질의 광학적 특성에 따라 흡수, 산란, 반사, 투과 등과 같은 광학 현상이 발생함. 이러한 광학 현상인 흡수, 산란, 반사, 투과 등에 의해 생체 조직에서의 빛 에너지 분포가 특정 지어지게 되며, 이 현상을 이용하면 질병진단, 암/종양 유무, 생체물질의 농도, 종류 등을 분석할 수 있다.
2.2 분광기 셋업
본 연구에서 수행된 비침습적 알코올 농도 측정을 위한 실험 구성도를 나타낸다. 측정 샘플의 움직임을 방지하기 위해 광학 테이블 위에 고정할 수 있도록 광학 홀더 및 기구를 사용하여 셋업을 설계하였다. 근적외선 분광기 모듈(DLP NIRscan Nano EVM, Texas Instruments, USA)의 윈도우는 측정 샘플의 중심에 위치하도록 배치하여, 연속 샘플링 중 발생할 수 있는 오류를 최소화하였다. 또한, 샘플과 분광기 모듈 윈도우에 흠집이 생기는 것을 방지하고, 모듈과 샘플 사이의 일정한 간격(1 mm)을 유지하기 위해 슬라이드 글라스(1 mm 두께)를 삽입하였다.
2.3 분광기 측정 과정
근적외선 분광기 모듈 내에서 측정샘플을 통과하는 빛의 에너지 전달 과정은 다음과 같다. 사용된 분광기 모듈은 900- 1,700 nm 범위의 근적외선 파장대에서 동작한다. 광원은 두 개의 광대역 텅스텐 필라멘트 램프로 구성되어 있으며, 이 NIR 광원은 윈도우를 통해 샘플에 조사된다. 샘플에서 반사된 빛은 다시 윈도우를 통해 들어와 슬릿을 통과하고, 회절(Diffraction) 과정을 거치며 광 분산이 일어난다. 분산된 빛은 첫 번째 집광 렌즈(Collimating Lens)를 통해 평행광으로 변환되며, 이후 885 nm 파장통과필터(Wavepass Filter)를 통해 근적외선 이상의 빛만 통과시킨다. 통과된 빛은 회절 격자에 의해 파장에 따라 분산된다. 이 빛은 마이크로 미러에 반사된 후, 두 번째 집광 렌즈를 통과하여 InGaAs 검출기(Detector)에서 광학 신호로 감지된다. 이때 InGaAs 디텍터의 물리적 특성에 의해 최대 측정 가능한 파장은 약 1,700 nm 정도로 제한되며, 따라서 근적외선 영역의 광신호 값이 검출된다.
2.4 샘플 제작
알코올 농도 측정을 위해 제작된 샘플은 0%에서 40%까지 10% 간격으로 총 5개의 혼합 용액을 제조하였다. 각 측정 샘플은 에탄올과 증류수(Deionized Water)를 전자 저울을 사용하여 정밀하게 측정하면서 제작하였다. 또한, 생체조직은 높은 산란 특성을 가지고 있다. 생체 환경을 모사하기 위해 일반적으로 널리 쓰이는 산란체로써 우유를 첨가하여 샘플을 제작하였다[
19-
22].
3. 데이터 분석 방법
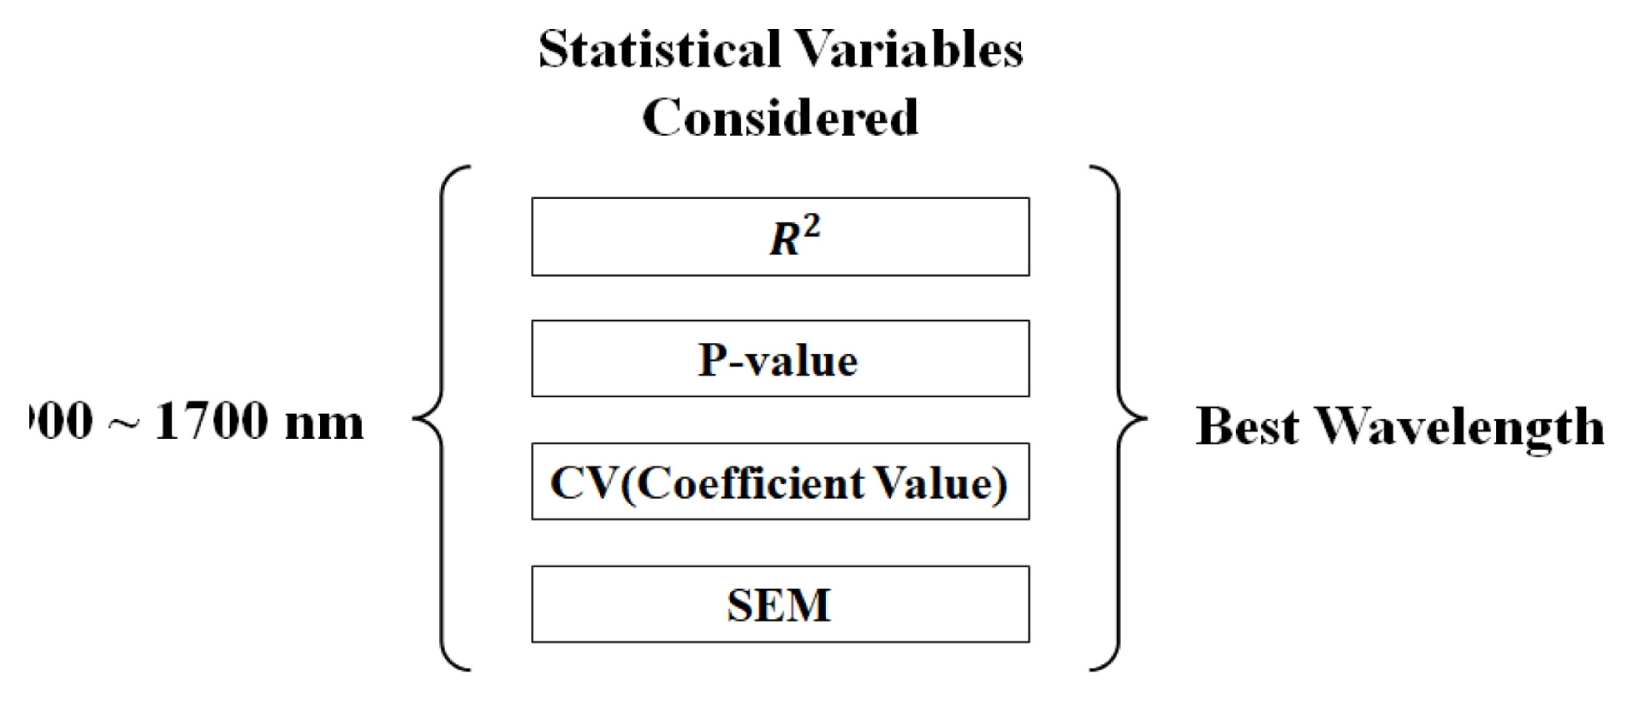
3.1 데이터 분석을 위한 특정 변수 및 파장 선정
NIR 파장 범위를 이용하여 비침습적으로 혈중 알코올 농도를 측정하기 위해 기초 연구로써 단일 에탄올 용액 샘플을 측정하여 파장에 따른 흡수도 변화(Wavelength vs. Abs)를 도출하였다. 근적외선 파장 영역에서 샘플의 알코올 농도를 도출하기 위해 적합한 특정 파장을 도출하기 위해 다양한 변수의 가중치를 부과하여 최적의 파장 순위를 도출한다.
분광분석에서 최적 파장 선정을 위해 네 가지 핵심 평가 지표를 활용하였다. 결정계수(R2)는 농도와 광 신호 간의 선형 관계를 나타내며, 1에 가까울수록 정확한 농도 예측이 가능하다. 유의확률(P-value)은 회귀 모델의 통계적 유의성을 검정하는 지표로, 0.05 이하일 때 농도-광 신호 관계가 통계적으로 유의함을 의미한다. 변동계수(CV)는 측정값의 상대적 변동성을 나타내며, 낮을수록 측정 정밀도가 높아 동일 농도에서의 반복 측정 일관성을 보장한다. SEM은 표본평균의 표준오차로, 동일 농도에서 반복 측정된 데이터 평균의 신뢰성을 나타내는 지표이며, 값이 낮을수록 재현성이 우수함을 의미한다.
3.2 다중 파장 데이터 처리 및 통계 분석
본 연구에서는 알코올 농도별 흡수도 데이터의 정량적 분석을 위해 Python 기반의 데이터 처리 및 통계 분석을 수행하였다. 우선, 실험 데이터 파일을 농도별로 분류·수집한 뒤, 전처리 과정에서 무한대 값(inf)과 결측값(NaN)을 해당 농도의 평균값으로 대체하였다. 이후 각 파장에 대해 농도별 흡수도의 평균, 표준편차, CV, SEM을 산출하였다. 농도와 흡수도 간의 선형성을 검증하기 위해 선형 회귀 분석을 수행하였으며, 이로부터 결정계수(R2)와 유의확률(P-value)을 계산하였다.
최적 파장 선정은 네 가지 통계 지표(R2, P-value, CV, SEM)를 기반으로 종합 점수를 산출하여 수행하였다. 전체 파장 중 종합 점수가 가장 높은 파장을 1순위로 선정하고, 이후 상위 3개 파장을 우선순위별로 선정하였다. R²은 농도 예측 정확성을 평가하는 핵심 지표이며, P-value는 통계적 유의성을, CV는 측정 정밀도를, SEM은 측정 재현성을 각각 반영하는 보완 지표로 활용하였다. 모든 평가지표는 비교 가능성을 확보하기 위해 0-1 범위로 정규화하여 적용하였다.
4. 결과 및 토론
본 연구에서는 알코올 농도별 광 신호 데이터(Absorbance)를 분석하여 통계적 변수를 통한 전체 파장에서의 값 변화 확인 및 다변수를 통한 종합평가를 통해 최적의 파장을 선정하고, 해당 파장에서의 분석 성능을 평가하였다.
파장별 성능 분석을 통해 특정 파장대의 특성을 파악하였다.
Fig. 4(a)의 R
2 분포를 통해 900-1,350 nm 구간에서는 R
2 값이 0.95 이상으로 안정적으로 높은 성능을 보였으며, 1,550-1,700 nm 구간에서도 0.95-1.00의 매우 높은 설명력을 나타내었음을 확인할 수 있다. 반면, 1,350-1,550 nm 구간에서는 R
2 값이 급격히 하락하여 0.77까지 모델 성능이 현저히 저하되는 것을 확인하였다.
Fig. 4(b)의 P-value 분포는 R
2 경향과 유사하게 1350-1,550 nm 구간에서 유의성이 크게 감소하여 10-2수준까지 증가함을 보여주었다. 측정 정밀도 측면에서 1,296.64 nm 파장은 CV 값이 0.004로 매우 낮아 높은 측정 정밀도를 보였으며,
Fig. 4(c)의 CV 분포를 통해 1,600 nm 이후의 높은 파장대에서는 CV 값이 급격히 증가하여 측정 신뢰도가 크게 저하되는 것을 확인하였다. 또한,
Fig. 4(d)의 SEM 분포는 1,296.64 nm에서 매우 낮은 값을 보여 안정적인 측정 재현성을 확인하였으나, 1,350 nm 이상 파장 영역에서는 안정성이 크게 저하되는 경향을 보였다.
Table 1에서는 해당 상위 3개 랭크 파장별로 결정계수(R
2), P-value, CV, SEM 등의 통계 지표를 정량적으로 비교하여 나타내었다. 상위 랭크 파장들의 통계적 성능 지표를 비교 분석한 결과, 1,296.64 nm 파장이 종합적으로 가장 우수한 성능을 보였다. 이 파장은 R
2 = 0.9850, P-value = 7.85 × 10
-4, CV = 0.0052, SEM = 0.0035를 나타내어 높은 선형성과 통계적 유의성, 우수한 측정 정밀도 및 안정성을 종합적으로 보여주었다. 2위 1,282.67 nm (R
2: 0.9862, P-value: 6.89 × 10
-4, CV: 0.0055, SEM: 0.0037)과 3위 1,286.17 nm (R
2: 0.9863, P-value: 6.85 × 10
-4, CV: 0.0056, SEM: 0.0037) 파장도 유사한 수준의 높은 성능을 보였으나, 1,296.64 nm 파장이 종합점수 0.9788로 가장 우수한 값을 나타내었다.
결론적으로, 1,296.64 nm 파장은 알코올 농도 정량 분석을 위한 최적 파장으로 선정되었으며, 이 파장에서 높은 선형성(R2 = 0.9850), 우수한 측정 정밀도(CV = 0.0052), 그리고 안정적인 측정 재현성(SEM = 0.0035)을 보여주었다.
Table 1에서 나타난 바와 같이 1,296.64 nm 파장에서의 통계적 평가 결과는 R
2 = 0.9850, P-value = 0.0008, CV = 0.0052, SEM = 0.0035로, 각각 매우 우수한 선형성, 통계적 유의성, 측정 정밀도 및 재현성을 보였다. 따라서 1,296.64 nm 파장은 본 연구의 알코올 농도 정량 분석에 가장 적합한 최적 파장임을 알 수 있다.
전체 파장 범위(900-1,700 nm)에서 알코올 농도 증가에 따른 흡수도 증가의 선형적 관계를 확인하였다.
Fig. 5(a)는 0%에서 40%까지의 다양한 알코올 농도에 따른 파장별 평균 흡수도 스펙트럼을 보여준다. 모든 농도에서 파장에 따른 흡수도 변화 패턴이 일관되게 나타났으며, 알코올 농도가 증가할수록 흡수도 값이 전반적으로 증가하여 농도별 스펙트럼이 명확하게 구분됨을 확인할 수 있다. 특히, 최적 파장으로 선정된 1,296.64 nm 지점에서는 농도별 흡수도가 더욱 명확하게 구분되며, 0%에서 40%까지의 농도 범위에서 흡수도 값이 약 1.57에서 약 1.76로 꾸준히 증가하는 선형적인 경향을 보였다.
Fig. 5(b)는 최적 파장(1,296.64 nm)에서의 알코올 농도와 흡수도 간의 관계 및 결정계수를 나타낸다. 이 파장에서의 R
2는 0.9850으로 매우 높은 선형성을 나타내었으며, P-value는 7.85 × 10
-4로 통계적으로 유의한 결과를 보였다. 최적 파장에서 도출된 1차 선형 회귀 방정식은 y = 0.004518x + 1.562058 이다. 파장별 성능 평가 결과, 1,296.64 nm가 최적 파장으로 선정되었다.
5. 결론
본 연구는 광학 방법을 통한 알코올 농도 측정의 가능성을 탐색하기 위해 넓은 농도 범위에 걸쳐 광신호(Absorbance)의 변화를 측정하였다. 실제 알코올 측정 상황에 적용하기 위해서는 신호 안정성을 확보할 수 있는 효과적인 시동 버튼 디자인 등 구조적 개선, AI 기반 보정 알고리즘 등 환경 변수에 의한 오차를 줄일 수 있는 알고리즘적 개선을 통해 신호 안정성을 향상시킬 수 있다. 본 연구에서 도출된 최적의 파장은 다른 생체 조건(개인-인종 간 피부 두께, 색상, 수분함량 등)에서는 다른 결과가 나타날 수 있다. 따라서 개인별 생체 특성에 따른 변수를 고려하기 위해 다양한 생체조건에서의 광범위한 데이터 베이스 구축 및 유효성 검증을 위한 추가 연구가 요구되어진다. 또한, 법적 기준 농도 범위 내에서의 연구가 추가로 필요 되며, 따라서 향후 연구에서는 생체 관련 물질, 동물 실험, 인체 대상 실험 등을 통해 법적 알코올 농도 수준을 고려한 검증을 진행할 예정이다. 이후 제안된 연구가 동물 실험을 통해 검증된다면, 이는 인체의 혈중 알코올 농도 측정에 활용될 수 있으며, 음주운전 방지 시스템에 실질적으로 통합될 수 있을 것으로 기대되어진다.
Fig. 1Spectrometer setup schematic
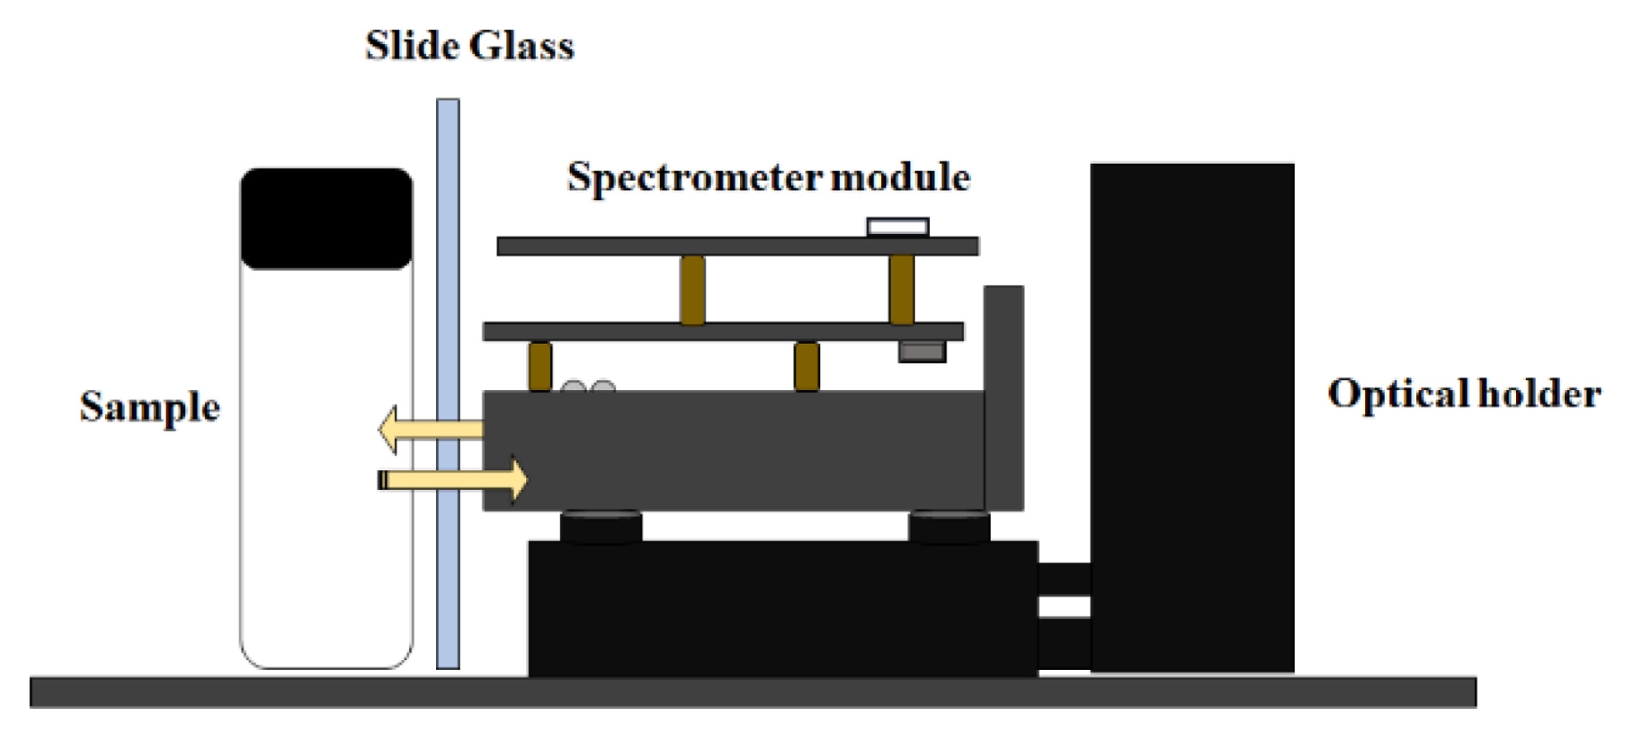
Fig. 2Schematic diagram of the sample preparation method
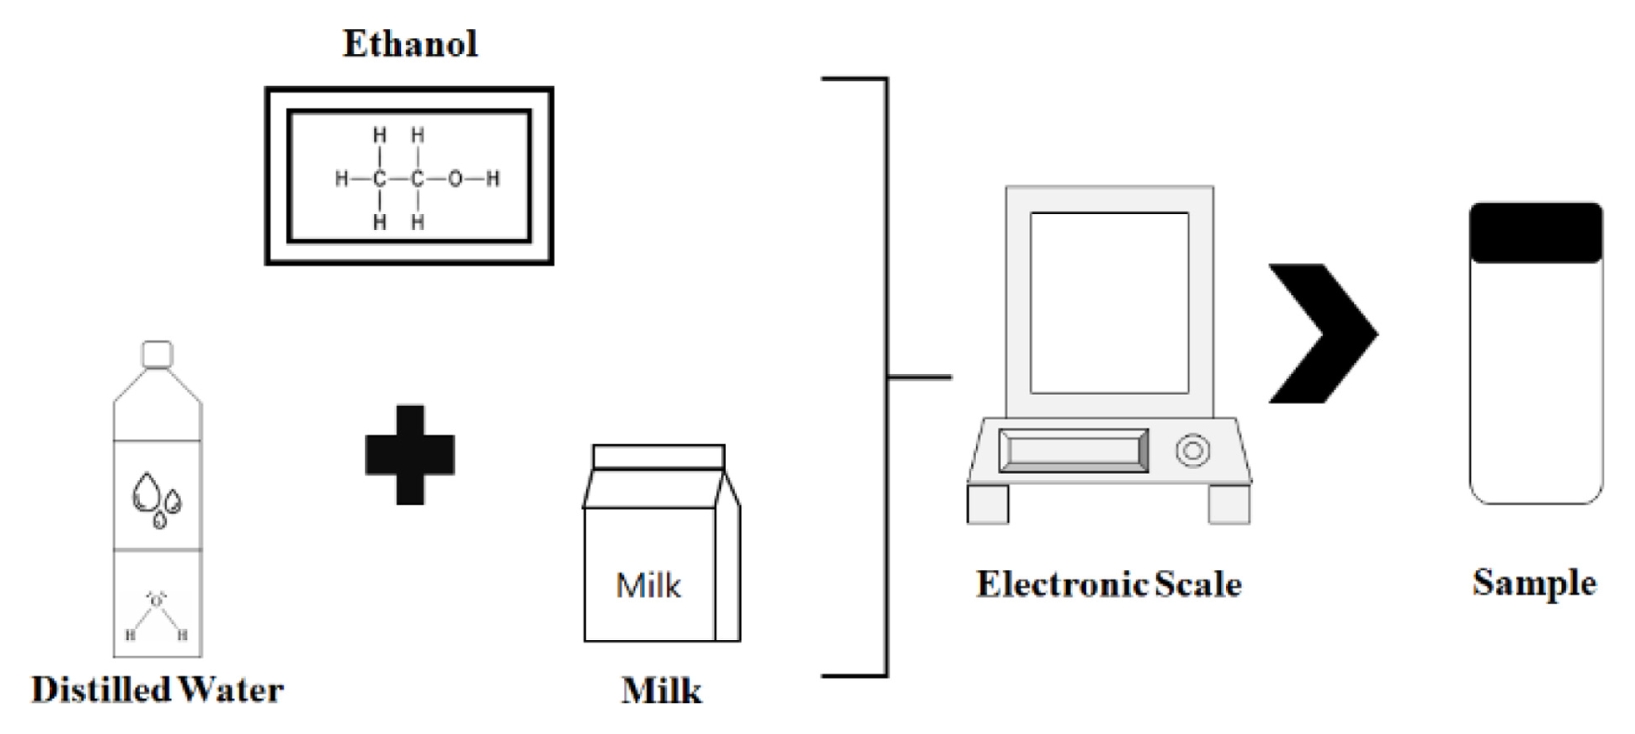
Fig. 3Data processing schematic for optimal wavelength selection using statistical variables

Fig. 4Changes in statistical performance indicators with respect to wavelength and optimal wavelength selection: (a) R2 values, (b) P-values, (c) Coefficient of variation (CV), and (d) Standard error of the mean (SEM)
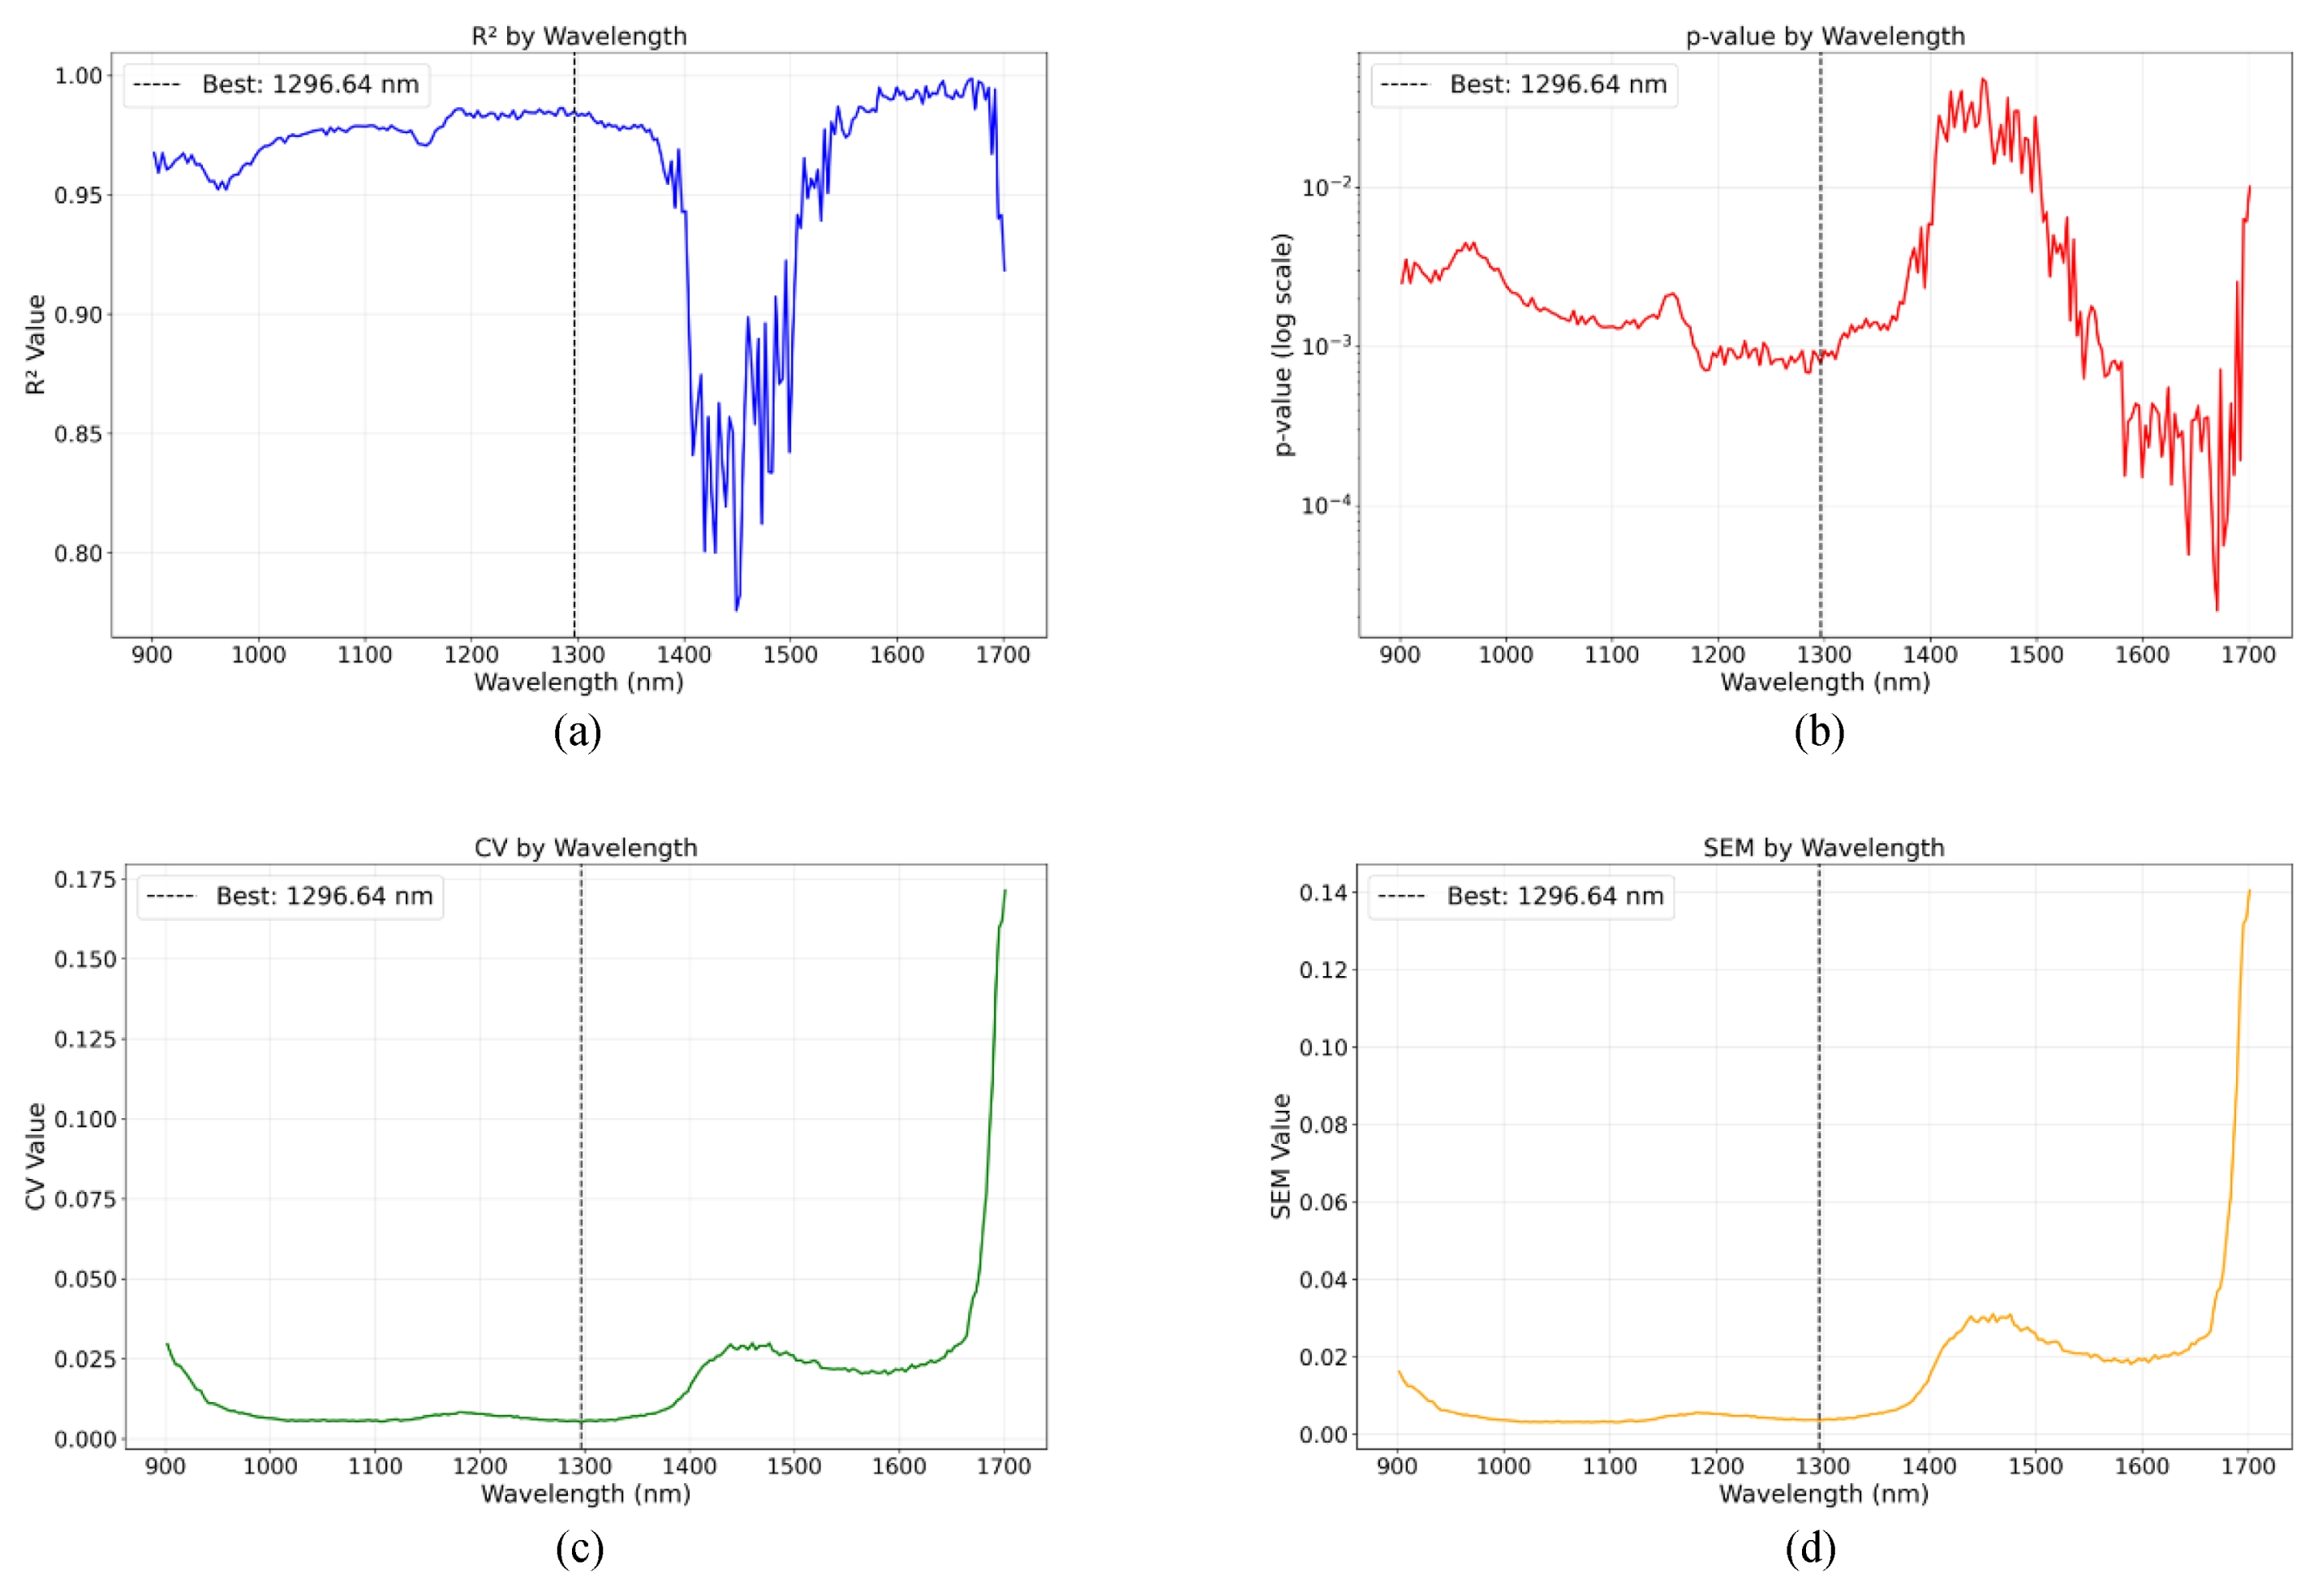
Fig. 5Changes in optical signal with respect to wavelength: (a) Mean absorbance spectrum (0–40% alcohol concentration), (b) Absorbance-concentration relationship at 1,296.64 nm
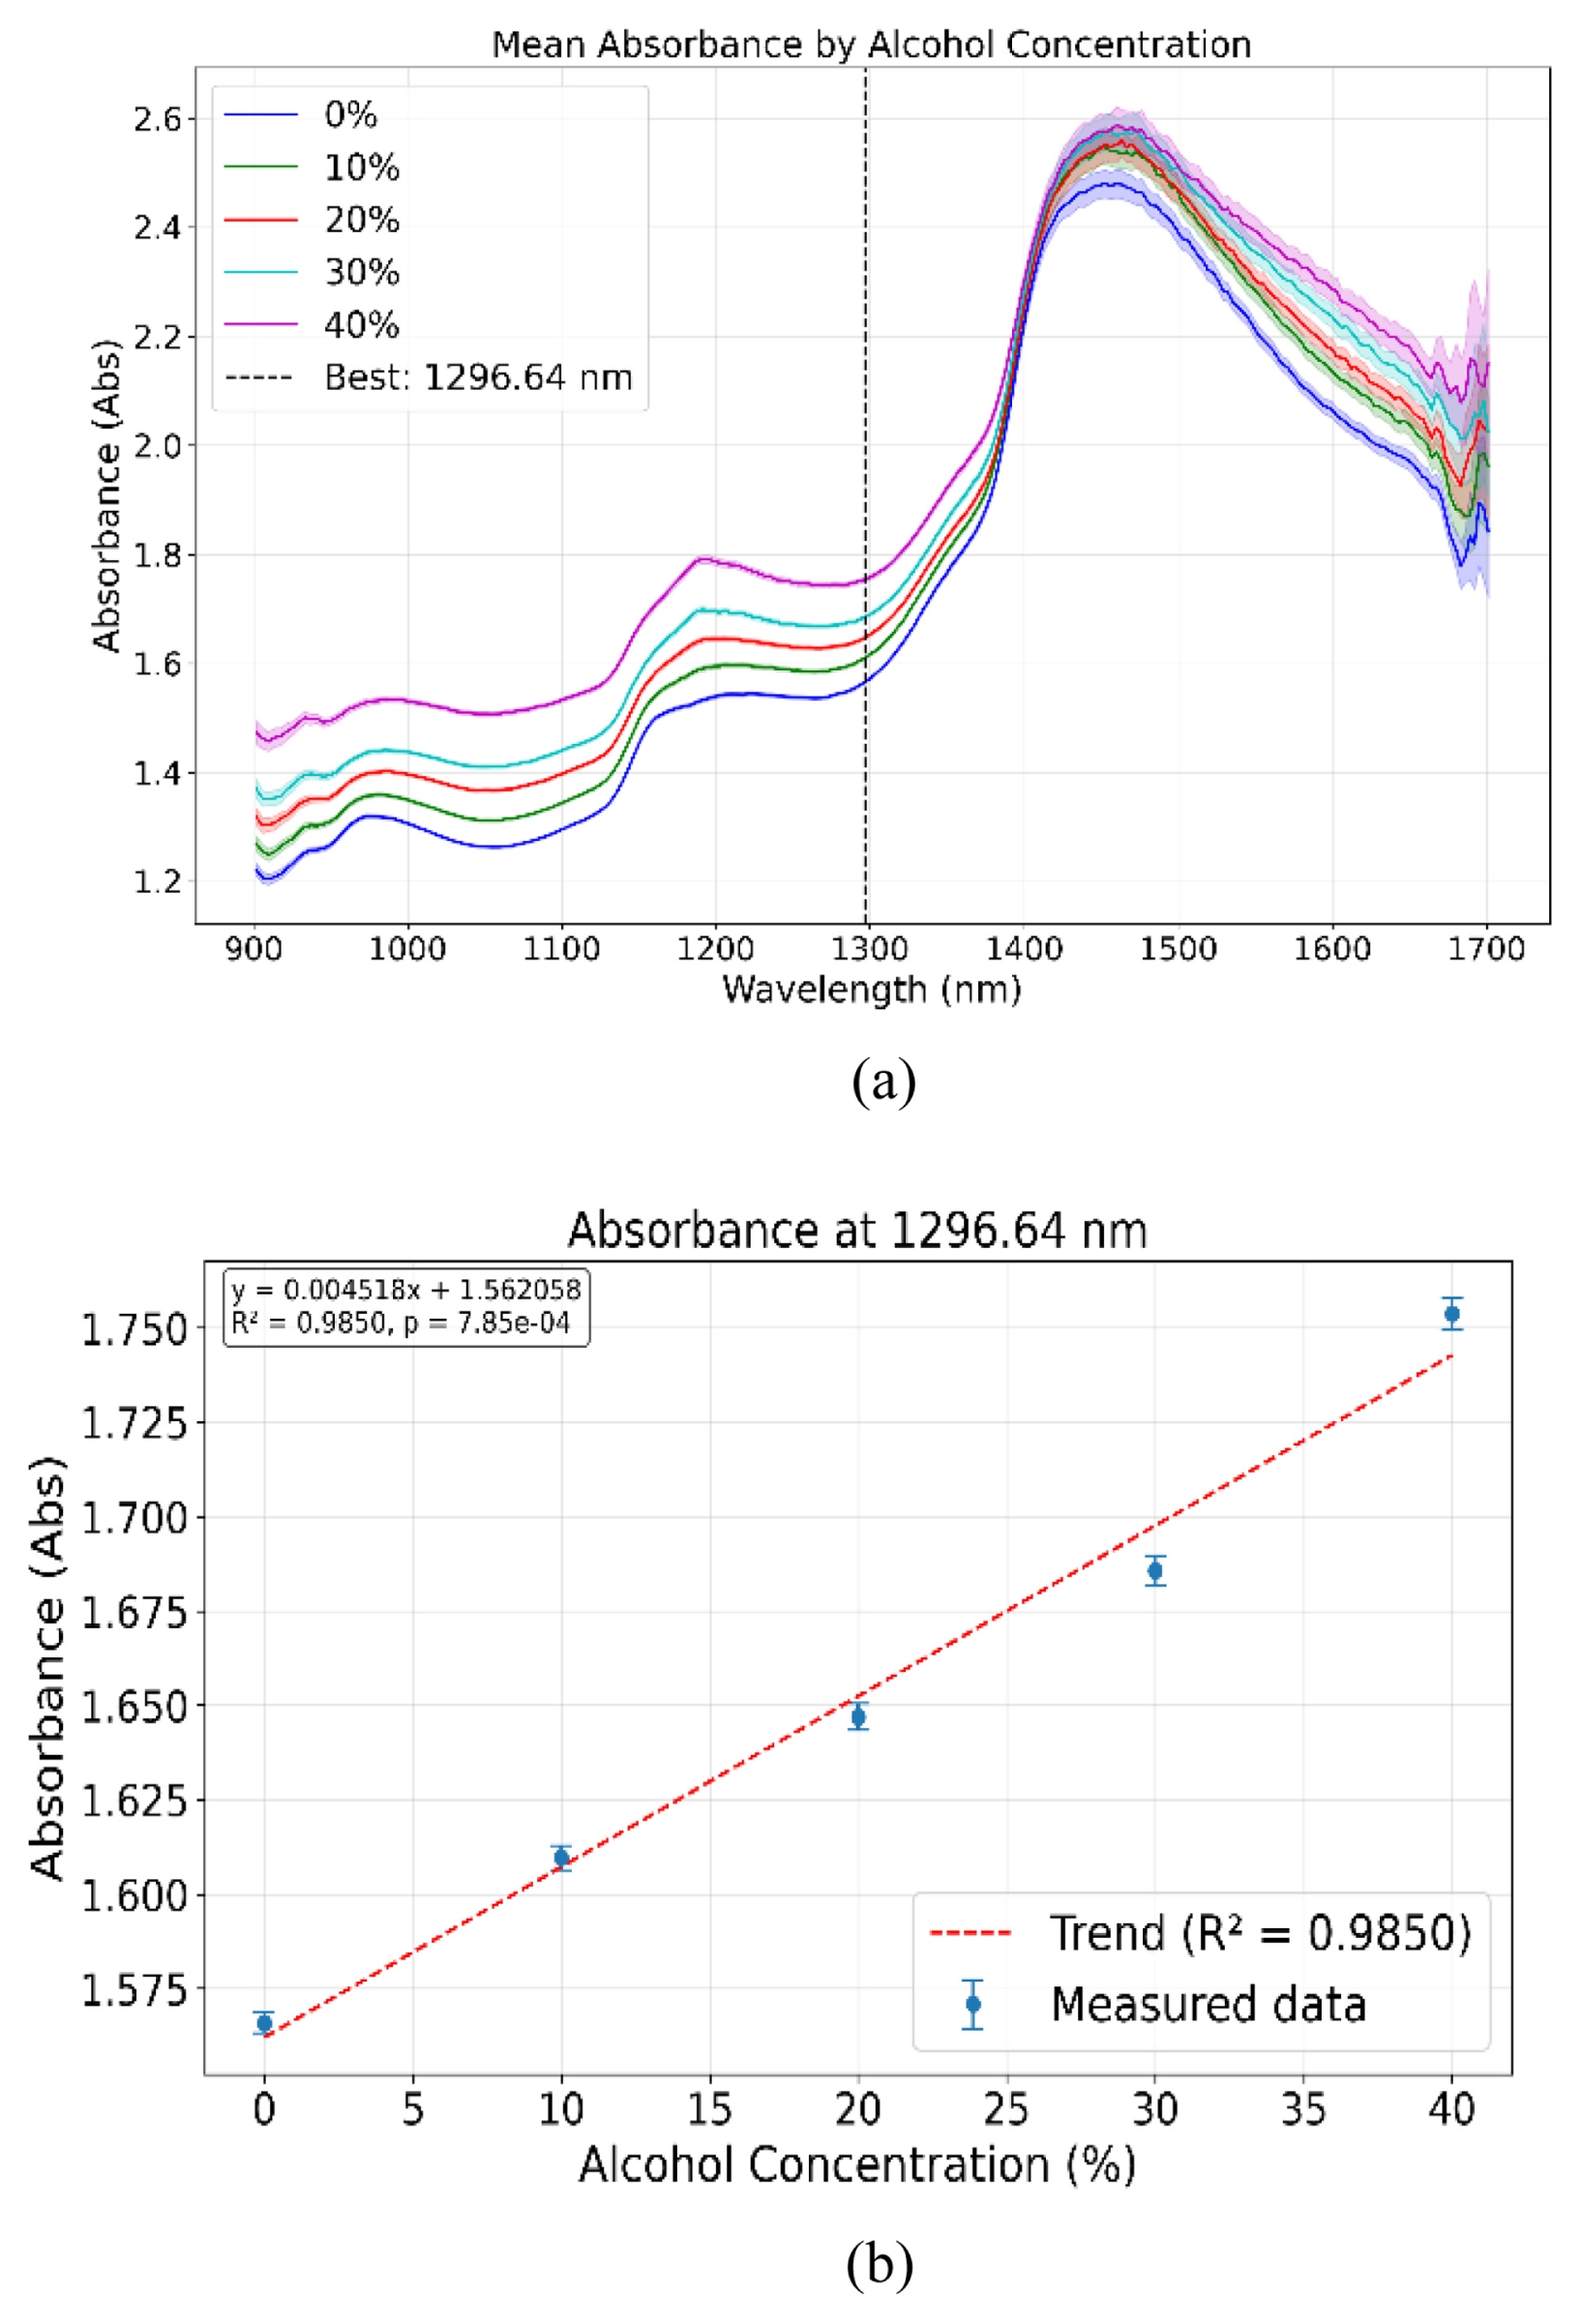
Table 1Statistical performance indicators by top wavelengths
Table 1
|
Rank |
1 |
2 |
3 |
|
Wavelength |
1296.64 |
1282.67 |
1286.17 |
|
R2
|
0.9850 |
0.9862 |
0.9863 |
|
P-value |
0.00078 |
0.00068 |
0.00068 |
|
CV |
0.0052 |
0.0055 |
0.0056 |
|
SEM |
0.0035 |
0.0037 |
0.0037 |
REFERENCES
- 1. Wolfe, M., Menon, A., Oto, M., Fullerton, N. E., Leach, J.-P., (2023), Alcohol and the central nervous system, Practical Neurology, 23(4), 273-285.
- 2. Mukherjee, S., (2013), Alcoholism and its effects on the central nervous system, Current Neurovascular Research, 10(3), 256-262.
- 3. Bragazzi, N. L., Dini, G., Toletone, A., Rahmani, A., Montecucco, A., Massa, E., Manca, A., Guglielmi, O., Garbarino, S., Debarbieri, N., (2018), Patterns of harmful alcohol consumption among truck drivers: Implications for occupational health and work safety from a systematic review and meta-analysis, International Journal of Environmental Research and Public Health, 15(6), 1121.
- 4. Ogden, E. J. D., Moskowitz, H., (2004), Effects of alcohol and other drugs on driver performance, Traffic Injury Prevention, 5(3), 185-198.
- 5. Bjornstig, U., Forsberg, R., (2016), Transportation disasters, In: Koenig and Schultz’s disaster medicine: comprehensive principles and practices. Cambridge University Press.
- 6. Borrelli, I., Gualano, M. R., Rossi, M. F., Capitanelli, I., Dolgetta, V., Santoro, P. E., Moscato, U., (2023), Alcohol consumption in healthcare workers and risk of workplace injury: A case-control study, Discover Sustainability, 4(1), 22.
- 7. Sawicki, M., Szóstak, M., (2020), Impact of alcohol on occupational health and safety in the construction industry at workplaces with scaffoldings, Applied Sciences, 10(19), 6690-6705.
- 8. Woodruff, S. I., Hurtado, S. L., Simon-Arndt, C. M., Lawrenz, J., (2018), An exploratory case study of environmental factors related to military alcohol misuse, BMC Public Health, 18(1), 902.
- 9. Thiebaud, P.-C., Martin, C., Naouri, D., Le Joncour, A., Truchot, J., Yordanov, Y., (2021), Alcohol consumption among french physicians: A cross-sectional study, Drug and Alcohol Dependence, 218, 108356.
- 10. Sendler, D. J., (2018), Physicians working under the influence of alcohol: An analysis of past disciplinary proceedings and their outcomes. Forensic Science International; 285: p. 29-37.
- 11. Afework, A., Tamene, A., Gashaw, M., (2025), Magnitude of self-reported non-fatal work-related injuries and associated factors among construction workers in Aleta Wondo, Sidama, Ethiopia, Scientific Reports, 15(1), 4339-4352.
- 12. Jones, A. W., (2019), Alcohol, its analysis in blood and breath for forensic purposes, impairment effects, and acute toxicity, Wiley Interdisciplinary Reviews: Forensic Science, 1(6), e1353.
- 13. Jones, A. W., (2020), The analysis of ethanol in blood and breath for legal purposes: A historical review. Alcohol, drugs, and impaired driving, 1st Edition, CRC Press.
- 14. Lindberg, L., Jones, A. W., (2022), The advantages of standardizing exhaled breath-alcohol concentration to a reference respiratory gas—water vapor, Journal of Breath Research, 17(1), 014002.
- 15. Jalal, A. H., Alam, F., Roychoudhury, S., Umasankar, Y., Pala, N., Bhansali, S., (2018), Prospects and challenges of volatile organic compound sensors in human healthcare, Acs Sensors, 3(7), 1246-1263.
- 16. Cabarcos, P., Álvarez, I., Tabernero, M. J., Bermejo, A. M., (2015), Determination of direct alcohol markers: A review, Analytical and Bioanalytical Chemistry, 407(17), 4907-4925.
- 17. Gamella, M., Campuzano, S., Manso, J., de Rivera, G. G., López-Colino, F., Reviejo, A., Pingarrón, J., (2014), A novel non-invasive electrochemical biosensing device for in situ determination of the alcohol content in blood by monitoring ethanol in sweat, Analytica Chimica Acta, 806, 1-7.
- 18. Kabir, A., (2018), Alcohol sensing through photonic crystal fiber at different temperature, Optics and Photonics Journal, 8(2), 45-52.
- 19. Albor-Ramírez, E., Reyes-Alberto, M., Vidal-Flores, L. M., Gutierrez-Herrera, E., Padilla-Castañeda, M. A., (2023), Agarose gel characterization for the fabrication of brain tissue phantoms for infrared multispectral vision systems, Gels, 9(12), 944.
- 20. Vaz, P. G., Humeau-Heurtier, A., Figueiras, E., Correia, C., Cardoso, J., (2018), Effect of static scatterers in laser speckle contrast imaging: An experimental study on correlation and contrast, Physics in Medicine & Biology, 63(1), 015024.
- 21. Nemati, M., Presura, C., Urbach, H., Bhattacharya, N., (2014), Dynamic light scattering from pulsatile flow in the presence of induced motion artifacts, Biomedical Optics Express, 5(7), 2145-2156.
- 22. Waterworth, M., Tarte, B., Joblin, A., Van Doorn, T., Niesler, H., (1995), Optical transmission properties of homogenised milk used as a phantom material in visible wavelength imaging, Australasian Physical & Engineering Sciences in Medicine, 18(1), 39-44.
Biography
- Ye Chan Cho
Master’s student in the Department of Biomedical Engineering, Konkuk University. His research interest is biomedical optics.
- Min Seok Park
Master’s student in the Department of Biomedical Engineering, Konkuk University. His research interest is biomedical optics.
- Min Seok Jeong
Undergraduate student in the Department of Biomedical Engineering, Konkuk University.
- Jae-Hoon Jun
Professor in the Department of Biomedical Engineering, Konkuk University. His research interest is biomedical optics.