ABSTRACT
This study presents an optimization framework for designing novel retainer rings (NRR) in chemical mechanical planarization (CMP) to enhance the uniformity of material removal rates (MRR). To improve optimization efficiency, we developed a finite element method (FEM) model alongside a Metamodel of Optimal Prognosis (MOP). The NRR outperformed the reference retainer ring (RRR) in our simulations. We classified simulation cases based on the pressure application area: long (LC), middle (MC), and short (SC). The MOP was constructed using Latin hypercube sampling and refined through an adaptive approach to achieve high accuracy while minimizing computational costs. Optimization was performed using an evolutionary algorithm, generating Pareto fronts for analysis. We evaluated representative designs based on MRR distribution and non-uniformity. Ultimately, Design 2-LC was identified as the optimal choice. The results indicate that the proposed framework effectively enhances MRR uniformity while reducing optimization time.
-
KEYWORDS: Chemical mechanical planarization, Finite element analysis, Metamodel, Retainer ring
-
KEYWORDS: 화학적 기계적 평탄화, 유한요소해석, 메타모델, 리테이너링
1. Introduction
Chemical Mechanical Planarization (CMP) is a process that planarizes surfaces by combining chemical reactions with mechanical abrasion through abrasive particles. CMP enhances semiconductor chip integration and is indispensable in both frontend and back-end processes. In addition, its greater planarization length compared with other methods makes CMP a key technology in semiconductor manufacturing [
1-
5].
The CMP system mainly consists of a carrier head, slurry, platen, retainer ring and polishing pad. The wafer is placed under the carrier head, while the polishing pad is attached to the top surface of the platen. The carrier head has a membrane and retainer ring, which allow it to apply pressure and prevent the wafer from slipping out. During planarization, backing pressure is applied to the wafer as both the carrier head and platen rotate, thus generating normal stress and relative velocity between the wafer and the pad.
According to Preston’s equation, the material removal rate (MRR) depends on normal stress and relative velocity, which influence the MRR more strongly than other factors, such as chemical reactions [
6,
7]. Ideally, uniform pressure and velocity should be distributed across the wafer to ensure consistent MRR. However, excessive stress at the wafer edge leads to higher removal in that region, which causes reduced chip productivity, yield loss, degraded surface quality, and higher defect rates in subsequent processes [
8]. Thus, the carrier head is equipped with a retainer ring, which shifts stress concentration from the wafer edge to the ring. As a result, a more uniform contact stress across the wafer surface can be achieved [
3].
However, when excessive force is applied to the retainer ring, it may cause deformation of the pad and result in non-uniform contact stress. Therefore, the selection and optimization of the retainer ring design are essential.
For this reason, researchers have investigated methods to improve MRR uniformity. Park et al. proposed the edge profile control ring and reported that it effectively reduced within-wafer non-uniformity [
9]. Park et al. proposed a step structure in the retainer ring to improve stress distribution and enhance MRR uniformity during chemical mechanical planarization [
10].
However, these studies did not focus on optimizing the proposed retainer ring design because experimental optimization is limited by cost and time. In this study, a novel retainer ring (NRR) was proposed and optimized using a metamodel coupled with finite element method (FEM) analysis to improve MRR uniformity in rotary-type CMP equipment for 8-inch wafers.
Although FEM provides high accuracy, it requires significant computational resources, thus increasing the optimization time [
11]. A metamodel is a simplified mathematical model that represents a complex system. It enables faster prediction of system behavior by replacing detailed simulations or experiments.
In this study, multi-objective optimization based on a metamodel was applied using ANSYS optiSLang to achieve efficient optimization.
The NRR has an arch-shaped structure, in which geometric modifications applied for optimization purposes may lead to a trade-off with structural stability. Therefore, an objective function associated with mechanical stability is introduced to ensure the structural integrity of the structure.
Furthermore, two objective functions are defined to improve wafer-scale MRR uniformity by simultaneously accounting for the upper and lower deviations of the contact stress distribution. In addition, one objective function is introduced to address the wear balance of the NRR. As a result, four objective functions are considered in this study, and a multi-objective optimization framework is employed to systematically address these competing objectives, and this multi-objective based metamodel approach is expected to be effective for CMP processes. Detailed descriptions of the objective functions are presented in Section 3.1.
2. Optimization
The CMP process involves complex interactions among mechanical factors such as pressure and velocity, as well as chemical reactions and processing time. However, the purpose of this study is to improve MRR uniformity using a retainer ring. Therefore, optimization considers only the influence of normal stress on the MRR, which has a greater impact on MRR than other factors such as chemical reactions [
12].
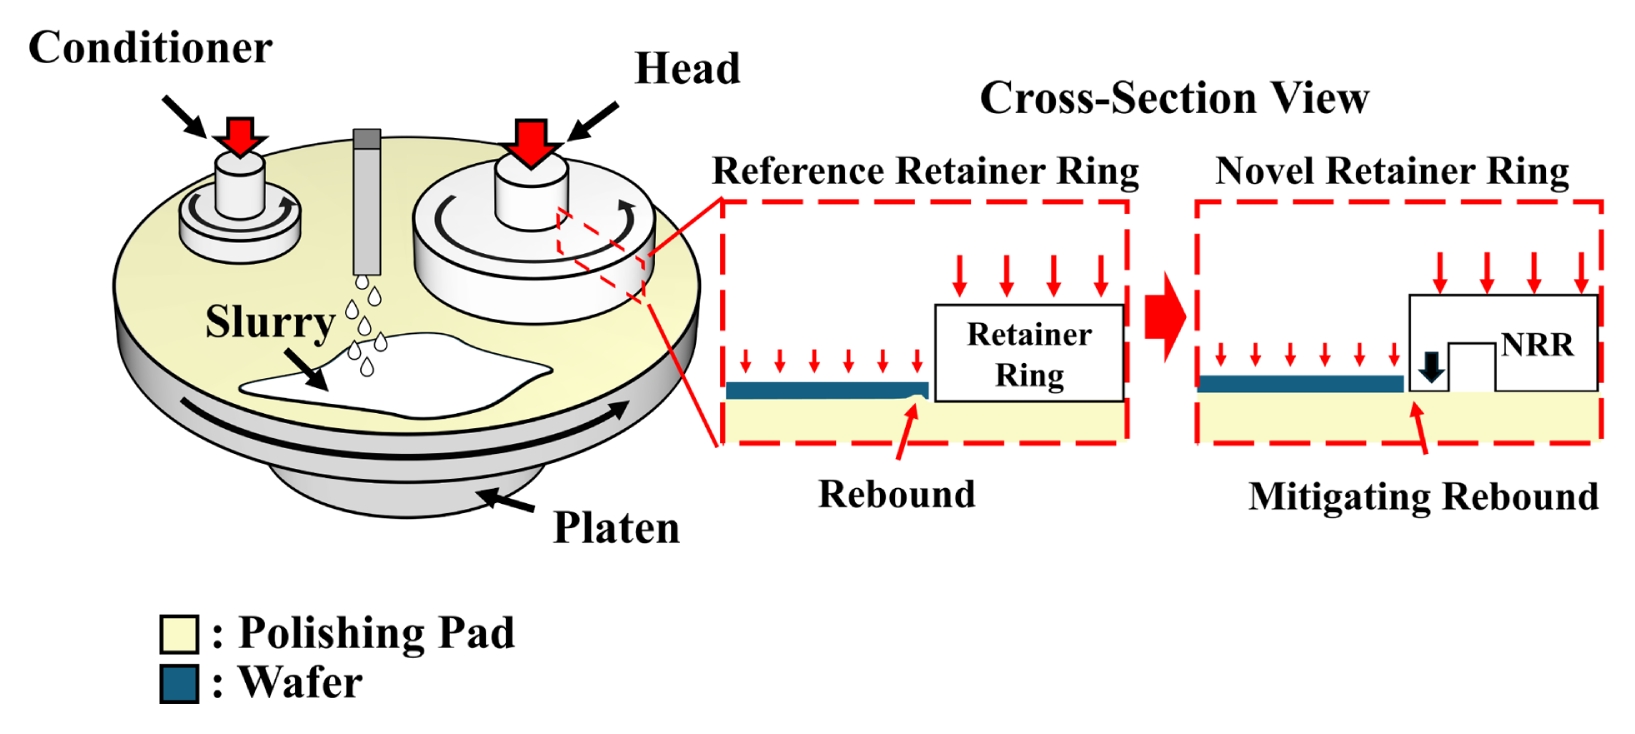
Fig. 1 shows a schematic diagram of the CMP process and the NRR. The NRR has an arch shape that introduces a bending effect, which helps reduce pressure on the pad when excessive force is applied to the retainer ring.
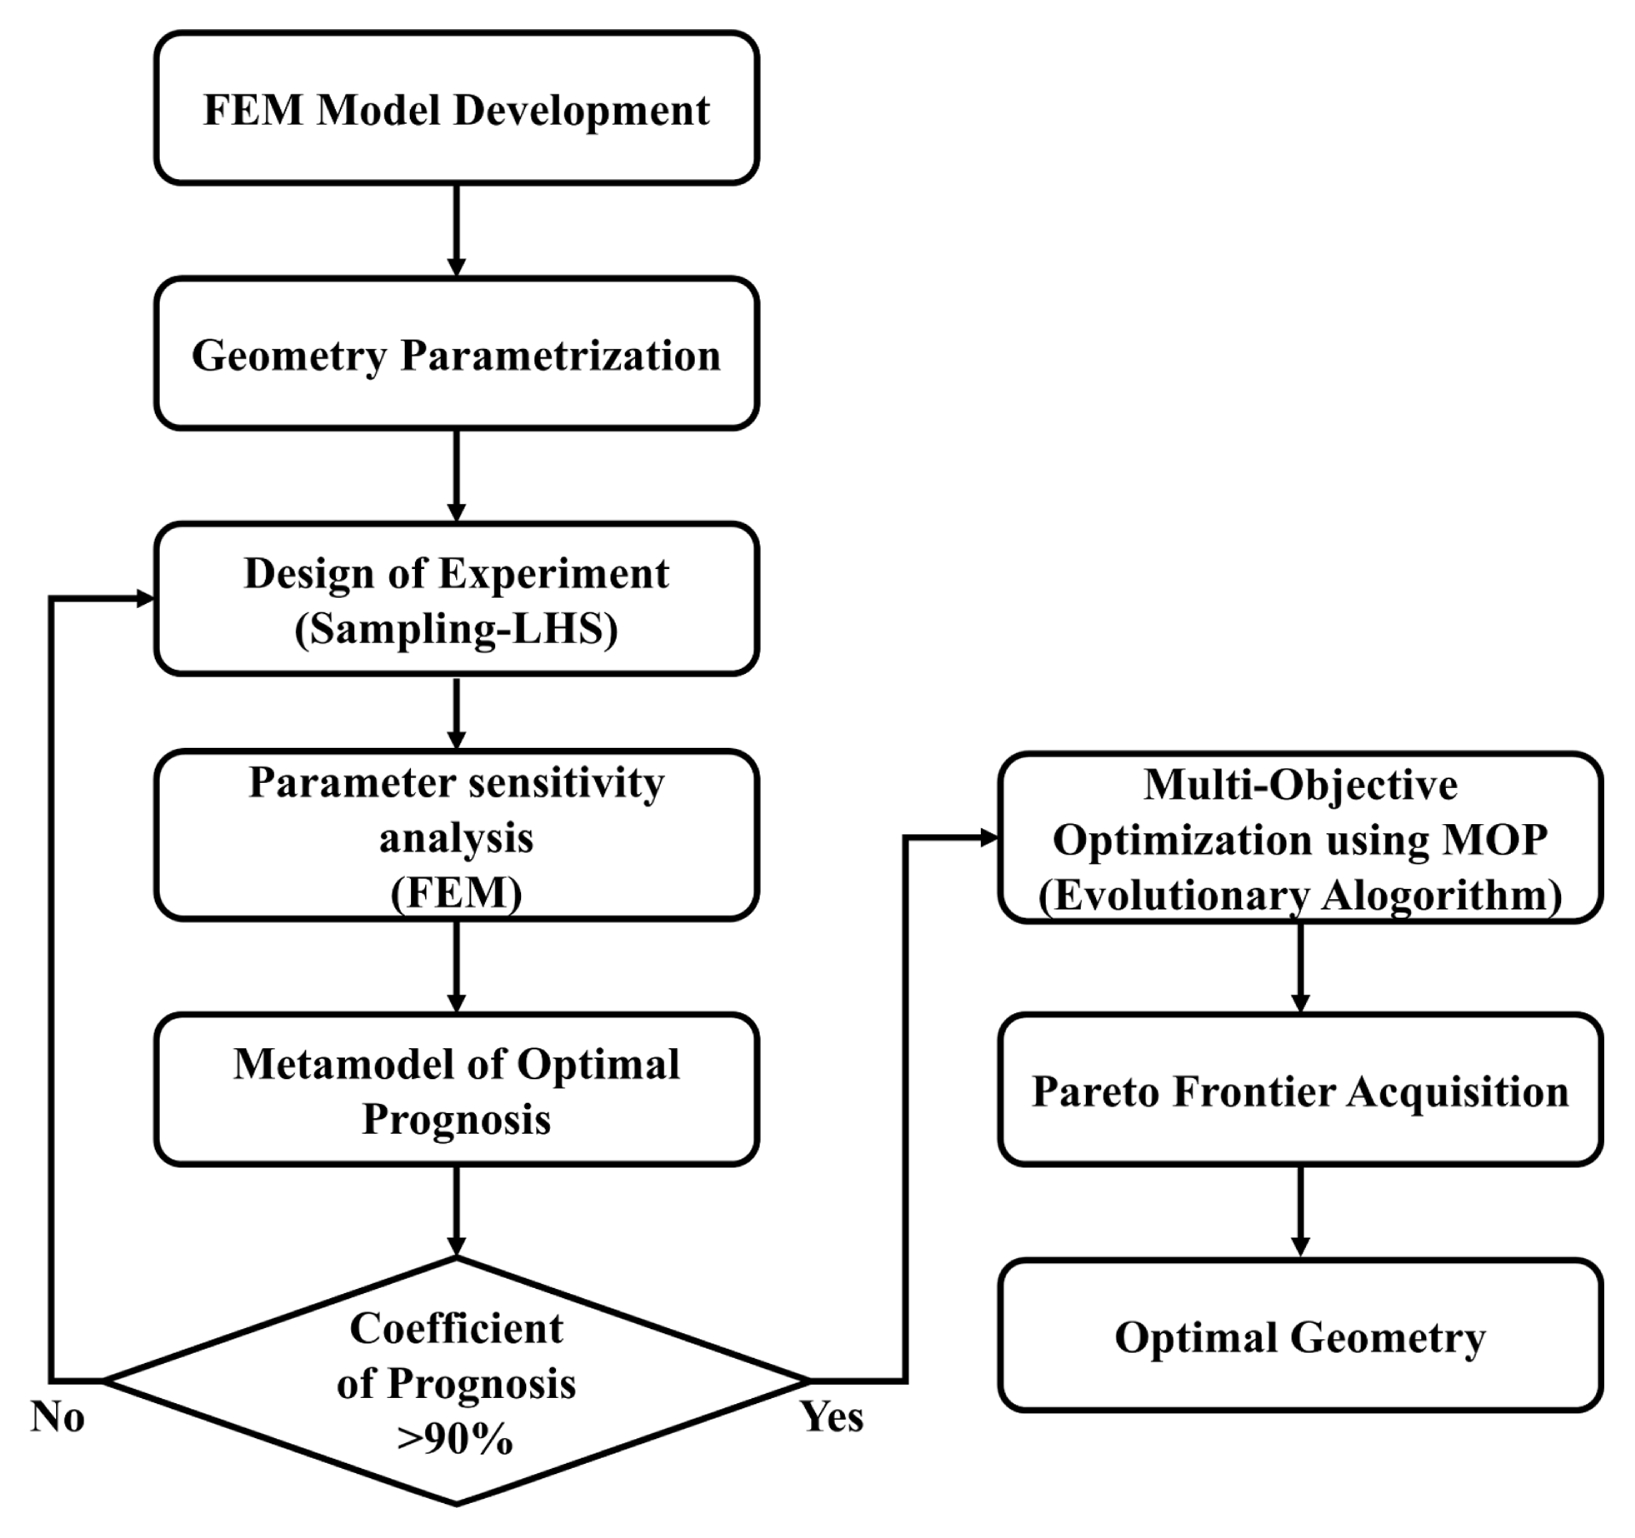
Fig. 2 presents the flowchart of the optimization procedure using FEM and a metamodel. The FEM model was first developed, and a metamodel was subsequently constructed based on the FEM results. The optimal solution was then obtained using an evolutionary algorithm (EA) applied to the metamodel.
2.1 Finite Element Method
Normal contact stress was evaluated using a two-dimensional (2D) axisymmetric static model.
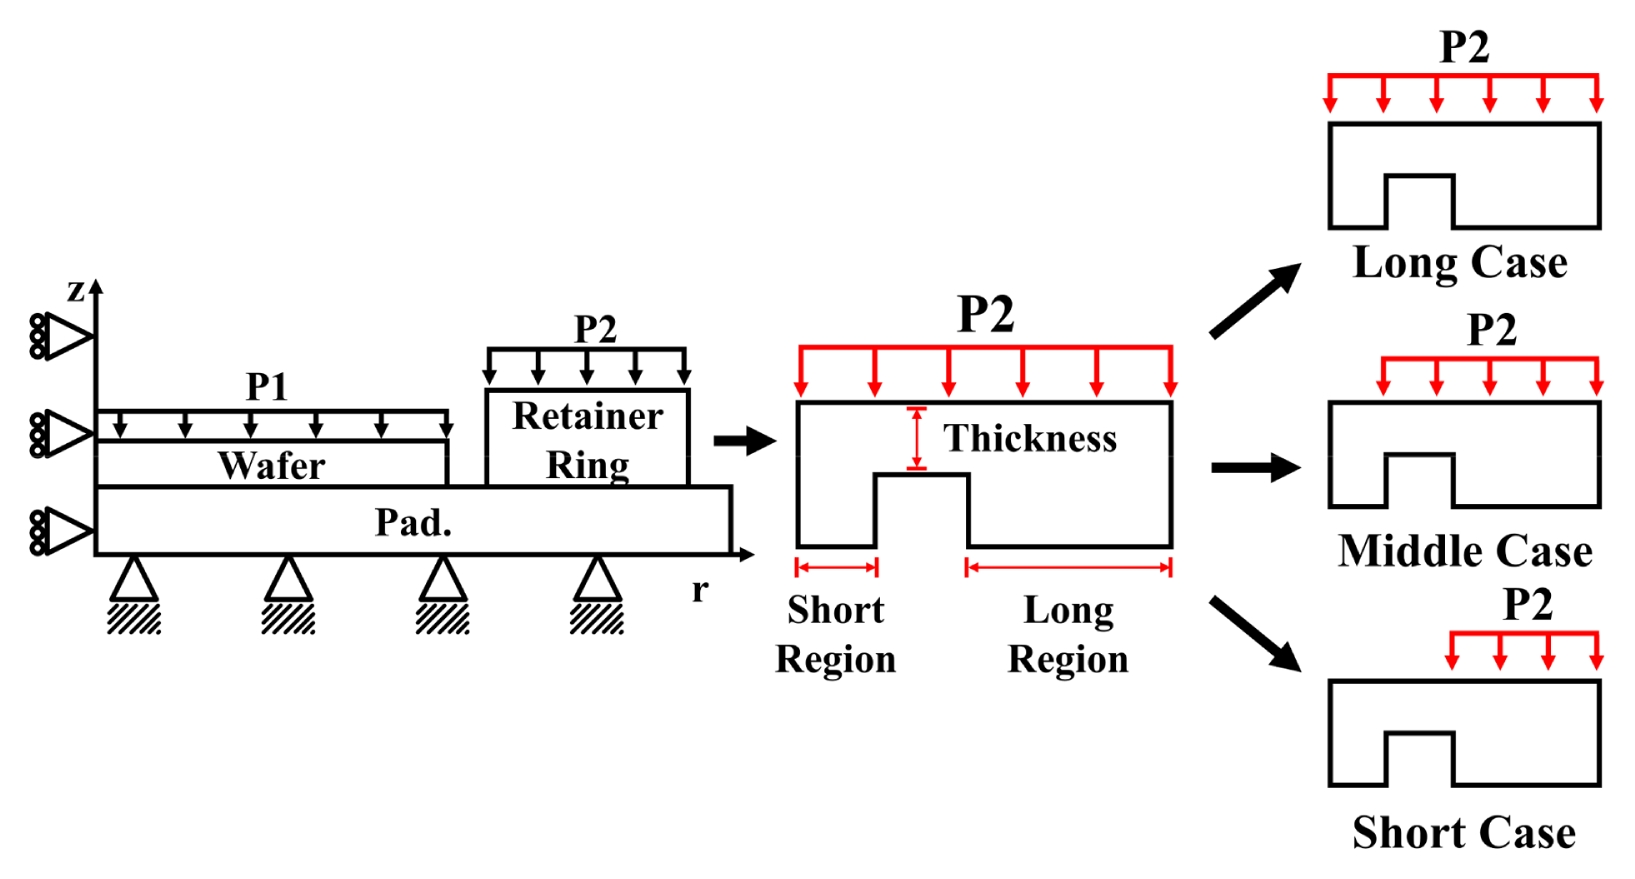
Fig. 3 illustrates the schematic diagram of the model, together with descriptions of the cases and parameters. The model was established based on the following assumptions [
12]: (1) All materials are isotropic and homogeneous. (2) The pressure acting on the wafer and retainer ring is uniformly distributed. (3) The surface of the wafer, polishing pad, and retainer ring are assumed to be perfectly smooth. (4) The wafer and the polishing pad are in contact at every point of the interface. (5) The relative velocity between the wafer and polishing pad is constant at all positions.
The material properties of the wafer, polishing pad, and retainer ring are listed in
Table 1. Since the simulation results vary with mesh size, verifying mesh independence is essential to ensure the reliability of the results [
13]. A mesh independence test was therefore conducted using various mesh sizes.
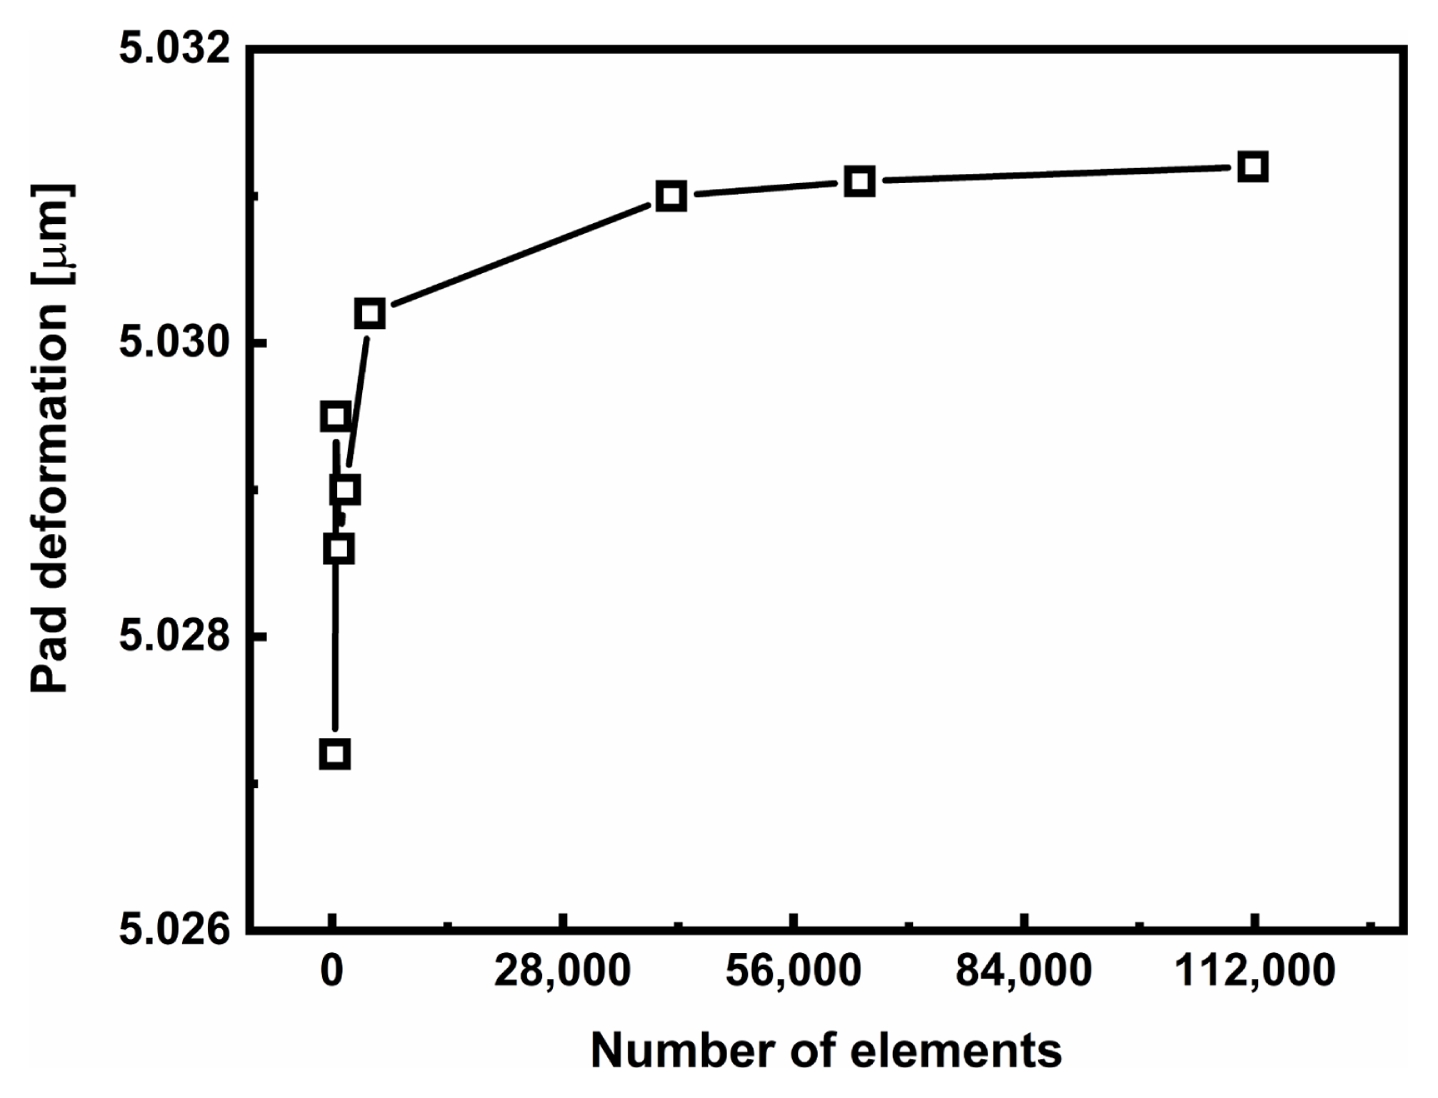
Fig. 4 shows the deformation of the polishing pad in the no-rebound region for different mesh sizes. The results indicate that a mesh size of 0.1 mm provides a good balance between reliability and computational efficiency. Consequently, a mesh size of 0.1 mm was adopted for all simulations.
The deformation of the polishing pad in the no-rebound region at the wafer and retainer ring region was validated by both experiment and simulation. The validation results are shown in
Table 2. In addition, the von-Mises stress distribution was calculated, since it reflects the expected contact stress uniformity and indicates the tendency of MRR uniformity [
14].
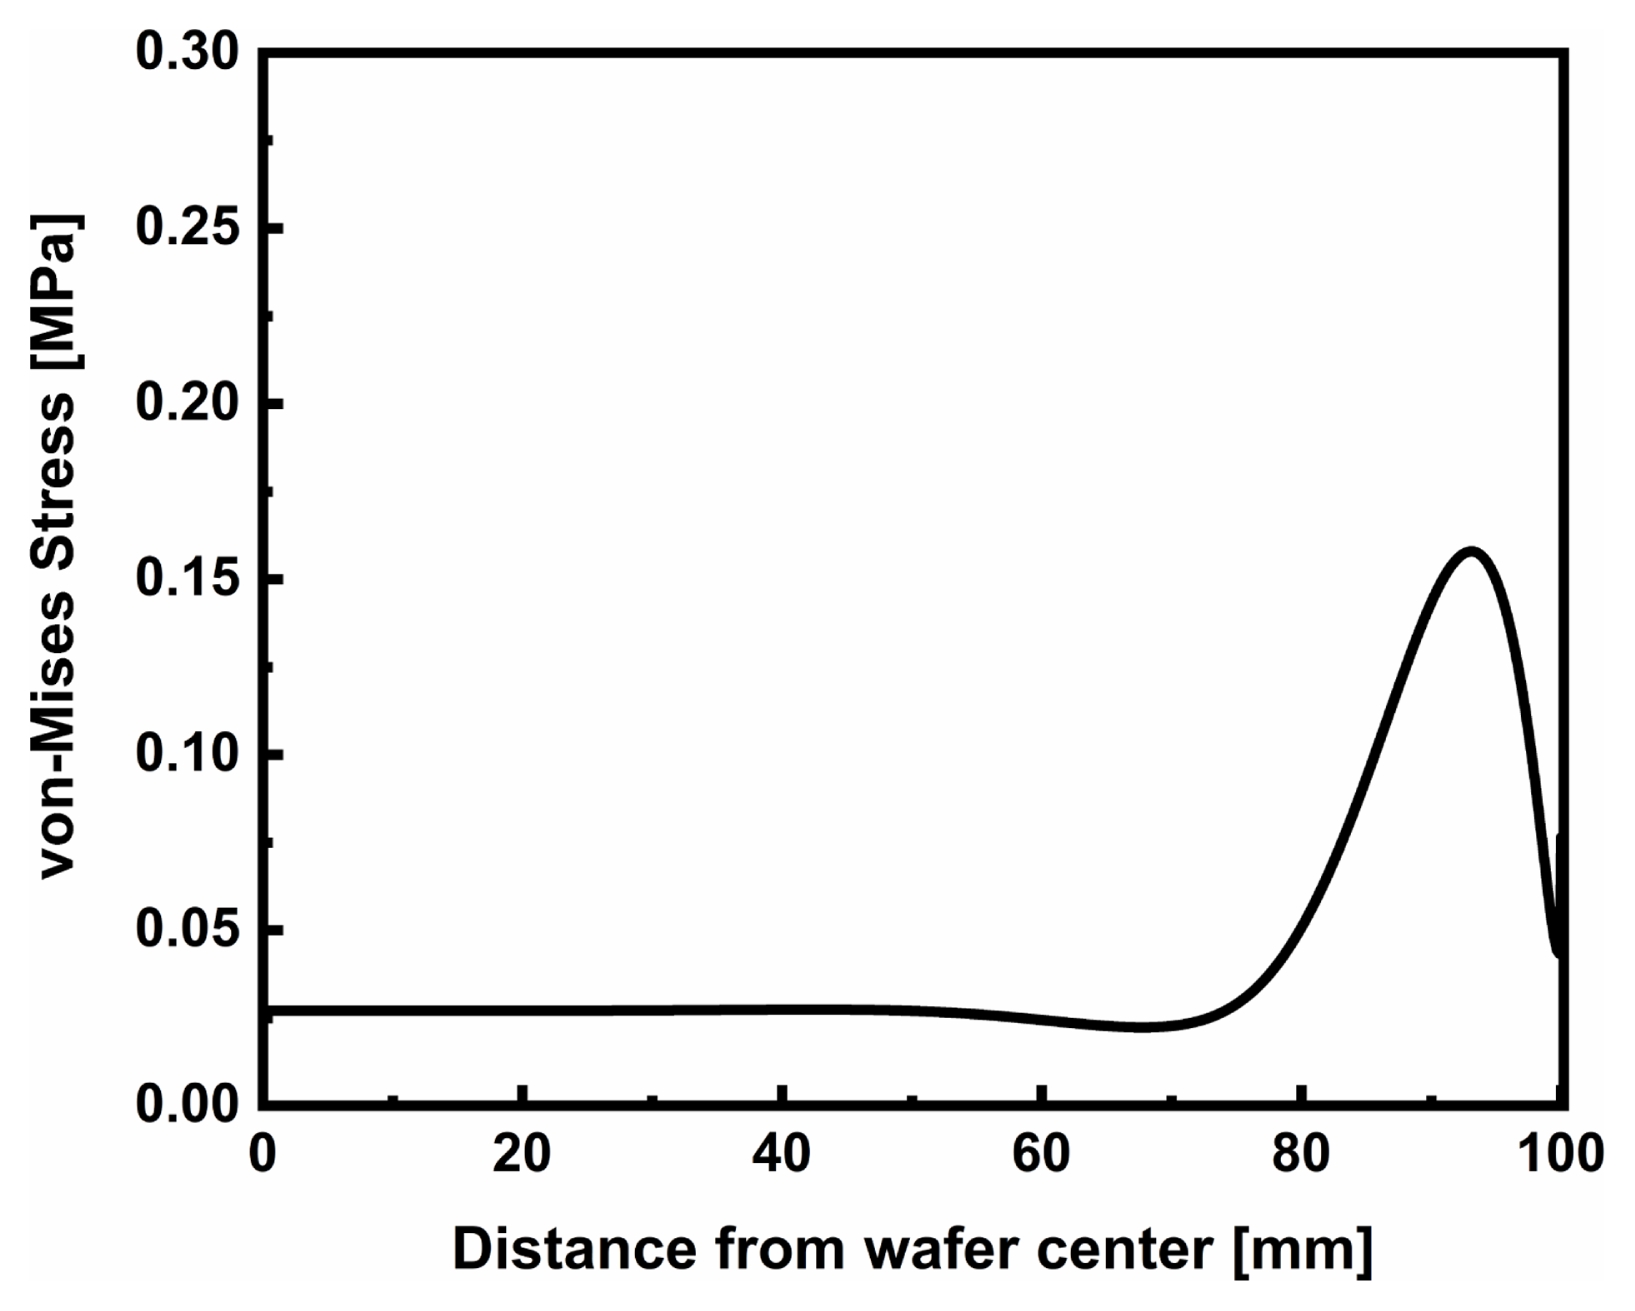
The von-Mises stress distribution is shown in
Fig. 5, where a sharp stress increase is observed at the edge region. Therefore, the model used in this study is suitable for predicting the nonuniformity on the wafer surface [
15].
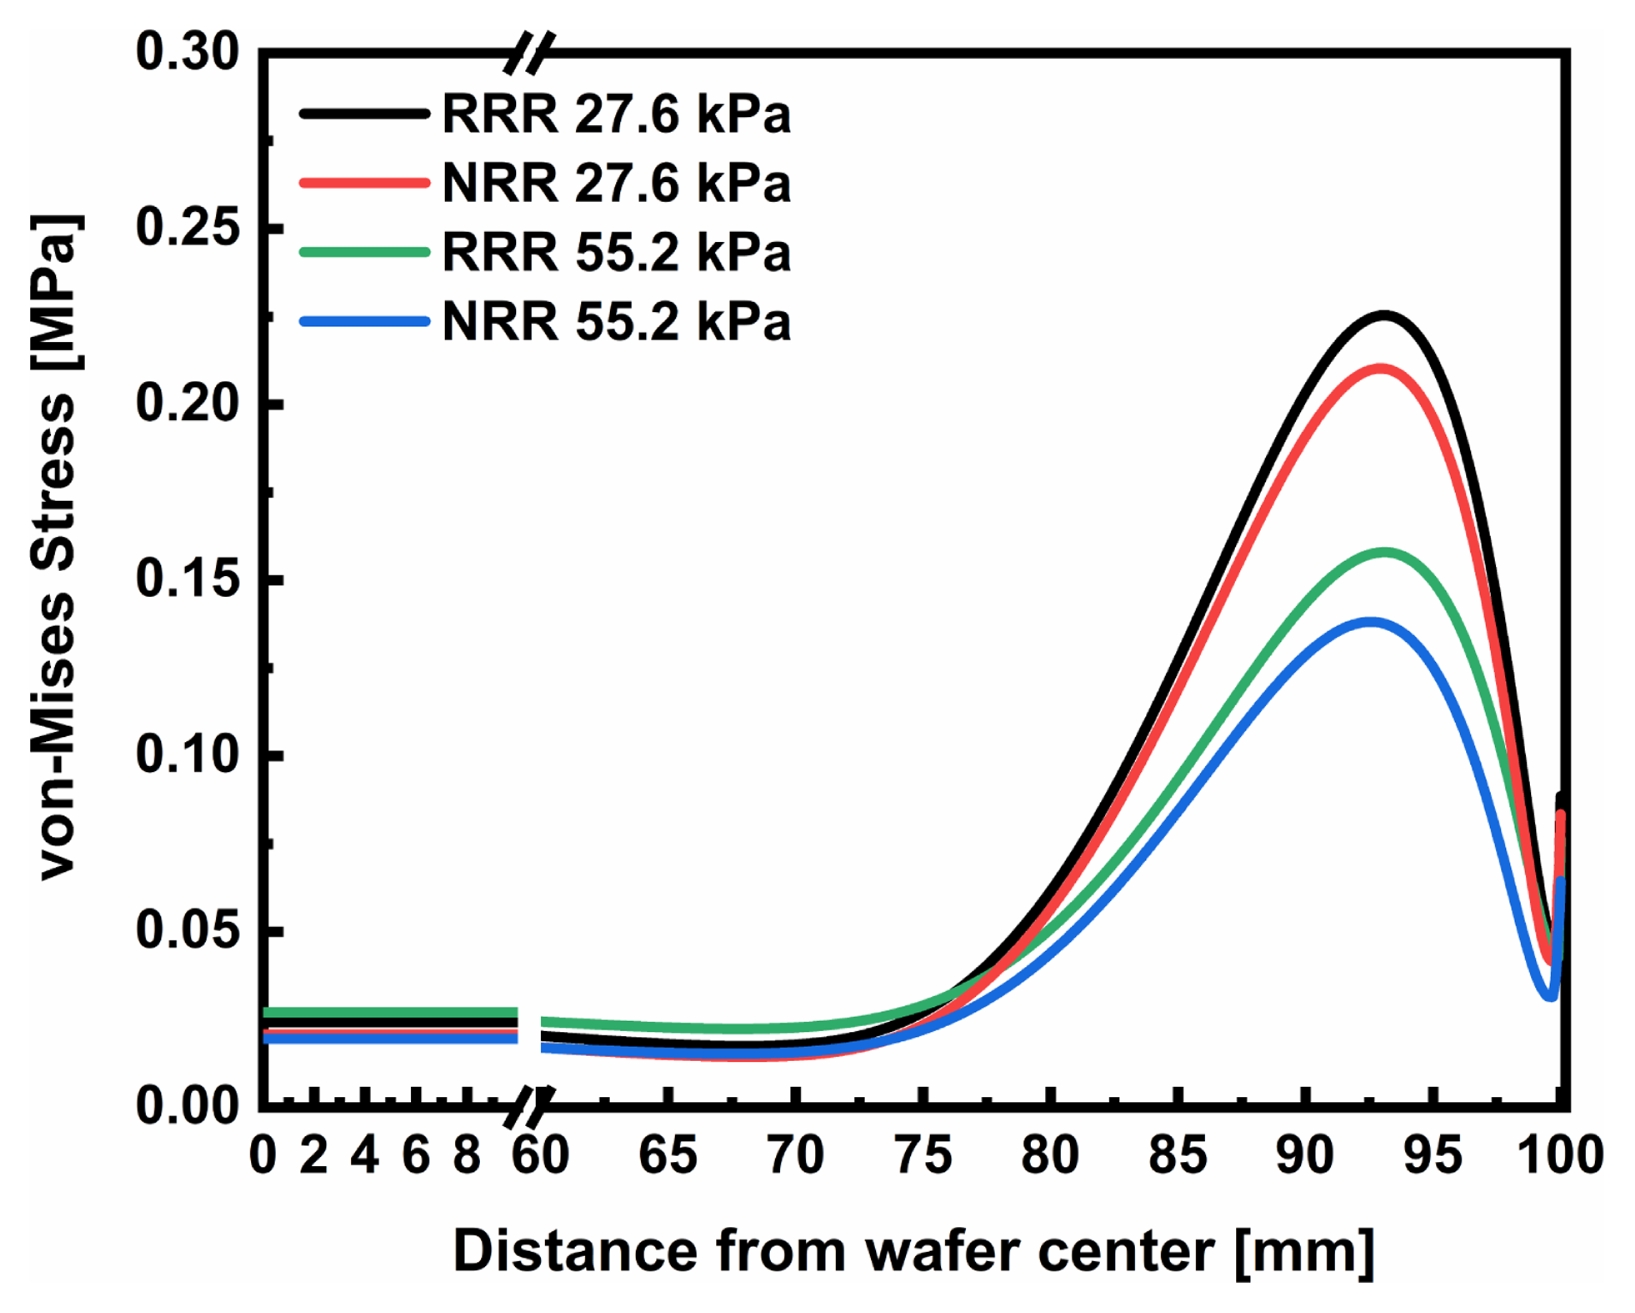
To assess the potential performance improvement of the NRR, the von-Mises stress distributions were calculated and compared for the reference retainer ring (RRR) and the NRR. When pressures of 27.6 and 55.2 kPa were applied to the retainer ring, the corresponding stress distributions are shown in
Fig. 6. The maximum stress of the NRR was lower than that of the RRR, indicating the potential performance advantage of the NRR. Since the bending effect of the NRR varies according to the size of the pressing area, the cases were classified as follows: long area case (LC), middle area case (MC), and short area case (SC). As mentioned previously, the details of each case are presented in
Fig. 3.
A metamodel is a mathematical model constructed to approximate a complex system. It enables efficient prediction of system responses by replacing detailed simulations or experiments [
16].
Optimization for each case was performed using the following parameters: short region length (L1), thickness (L2), long region length (L3), and head pressure (P2). The parameter ranges are listed in
Table 3.
The metamodel responses were chosen to reduce the nonuniformity of normal contact stress and to balance wear between the short and long regions of the NRR. Specifically, the responses included the minimum normal stress on the wafer surface (R1), maximum normal stress on the wafer surface (R2), and average normal stress on the wafer surface (R3).
Average pressure magnitude between the polishing pad and the short part (R4), which is the shorter region among the two contact areas where the NRR and the pad are in contact, and average pressure magnitude between the polishing pad and the long part (R5), which is the longer region among the two contact areas where the NRR and the pad are in contact. To confirm structural safety, the maximum von-Mises stress of the retainer ring was also included as a response (R6).
The metamodel of optimal prognosis (MOP) was constructed through a process consisting of design of experiments (DoE), parameter sensitivity analysis, and metamodel generation. DoE is a statistical technique designed to maximize information while minimizing the number of experiments and simulations.
Optimizing the NRR geometry requires extensive simulation data, which scales with the number of variables and results in higher computational cost. However, strategically selected data points can reduce this cost while maintaining analysis accuracy.
Several DoE methods exist. Traditional methods, such as full factorial designs, provide comprehensive coverage but become computationally expensive for high-dimensional problems.
An alternative is Latin Hypercube Sampling (LHS), a spacefilling technique designed to efficiently explore high-dimensional problems. LHS divides each input variable into equally probable intervals and randomly selects one sample from each interval. The selected samples are then randomly combined across variables, allowing the input space to be evenly covered. Compared to traditional methods, LHS can provide equivalent sampling quality with fewer samples, making it suitable for computationally expensive simulations [
17]. Therefore, LHS was adopted for DoE in this study.
Sensitivity analysis evaluates how variations in parameters influence the responses of a model. It is performed to quantify the influence of each parameter and to reduce the dimensionality of the input space.
Based on sensitivity analysis, the MOP is constructed by automatically selecting the most influential input variables together with an appropriate surrogate model. This process relies on the Coefficient of Prognosis (CoP). The results of the sensitivity analysis are represented by the CoP, which was calculated using equation [
18]:
Where SSEEPrediction represents the squared prediction errors and SST represents the sum of the squared total deviations. In addition, the CoP is used to evaluate the predictive accuracy of the metamodel. The CoP is calculated using test data excluded from model training, making it more reliable for confirming prediction accuracy. The CoP value close to 1 indicates higher predictive accuracy.
Metamodel are built based on Moving Least Square (MLS) and Kriging approximations.
MLS approximations can be regarded as an extension of polynomial regression. Although the basis functions can theoretically take various forms, linear and quadratic terms are commonly adopted in practice. The basis functions are constructed by obtaining the best local fit at the interpolation point. The approximation function is expressed as [
19].
Where y(xi) is the approximate value, pT is the polynomial basis and a(xi) is a moving coefficient that vary with location. As a result, MLS approximation is obtained using only the nearby points around each interpolation point.
Kriging approximations predict values by minimizing the variance of the estimation error of a weighted sum of sample data. The predicted value depends on the design variables and the distribution of the samples. The approximation function is expressed as [
20].
Where f(xi) is the trend function, β is the corresponding coefficient vector, and Z(xi) is a stochastic process. As a result, Kriging is regarded as a global method because the prediction is based on the overall data distribution and their correlations.
MLS and Kriging were employed as local and global models, respectively, and the prediction accuracy of the two methods was compared to select the better model.
In addition, the Adaptive Metamodel of Optimal Prognosis (AMOP) was adopted to improve the CoP of the metamodel. The AMOP iteratively refines sampling and rebuilds the metamodel until the CoP reaches the target accuracy. Through this process, significant variables are efficiently identified, and a reliable surrogate model is constructed. This enables accurate approximation of the design space, even in high-dimensional or nonlinear problems. Consequently, AMOP effectively reduces inefficiencies caused by high dimensionality and nonlinearity, allowing more comprehensive and efficient exploration of the design space [
21].
In conclusion, the metamodels of LC, MC, and SC were created, each of which achieved a target accuracy of 0.9 with 80, 145, and 100 samples, respectively. The details of the CoP are listed in
Table 4. A larger CoP value indicates greater input influence on the response.
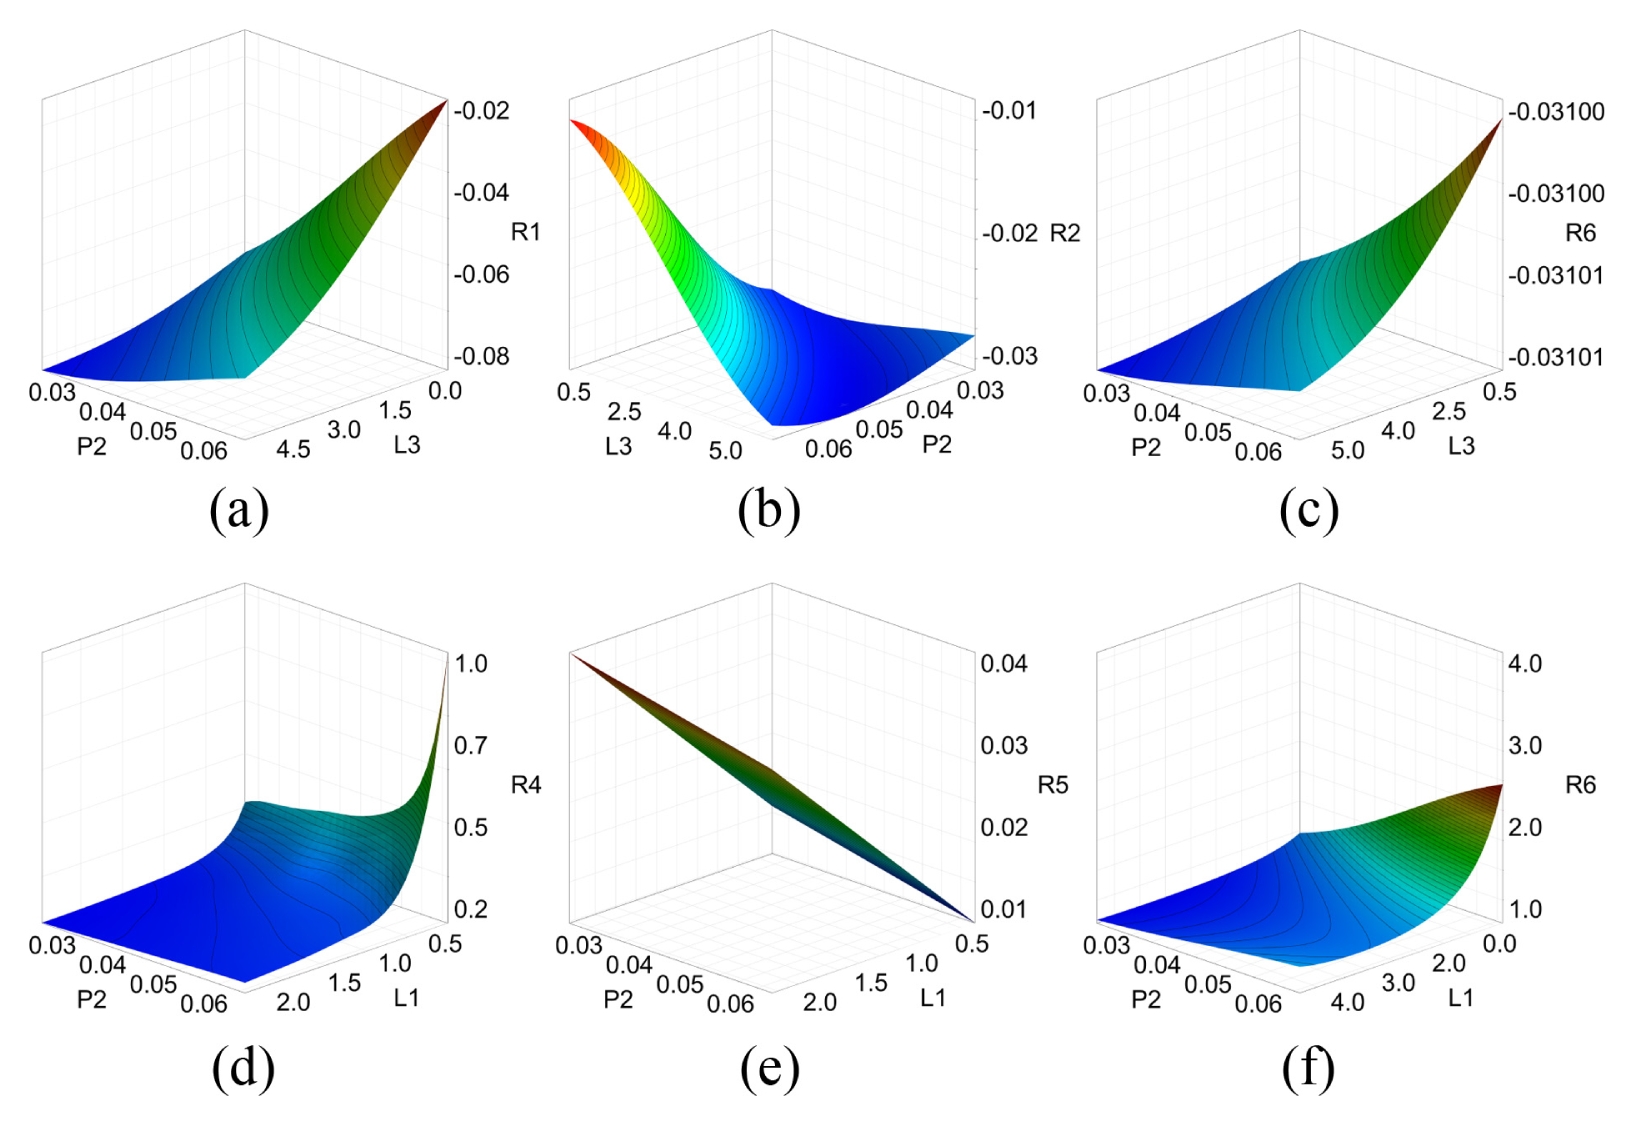
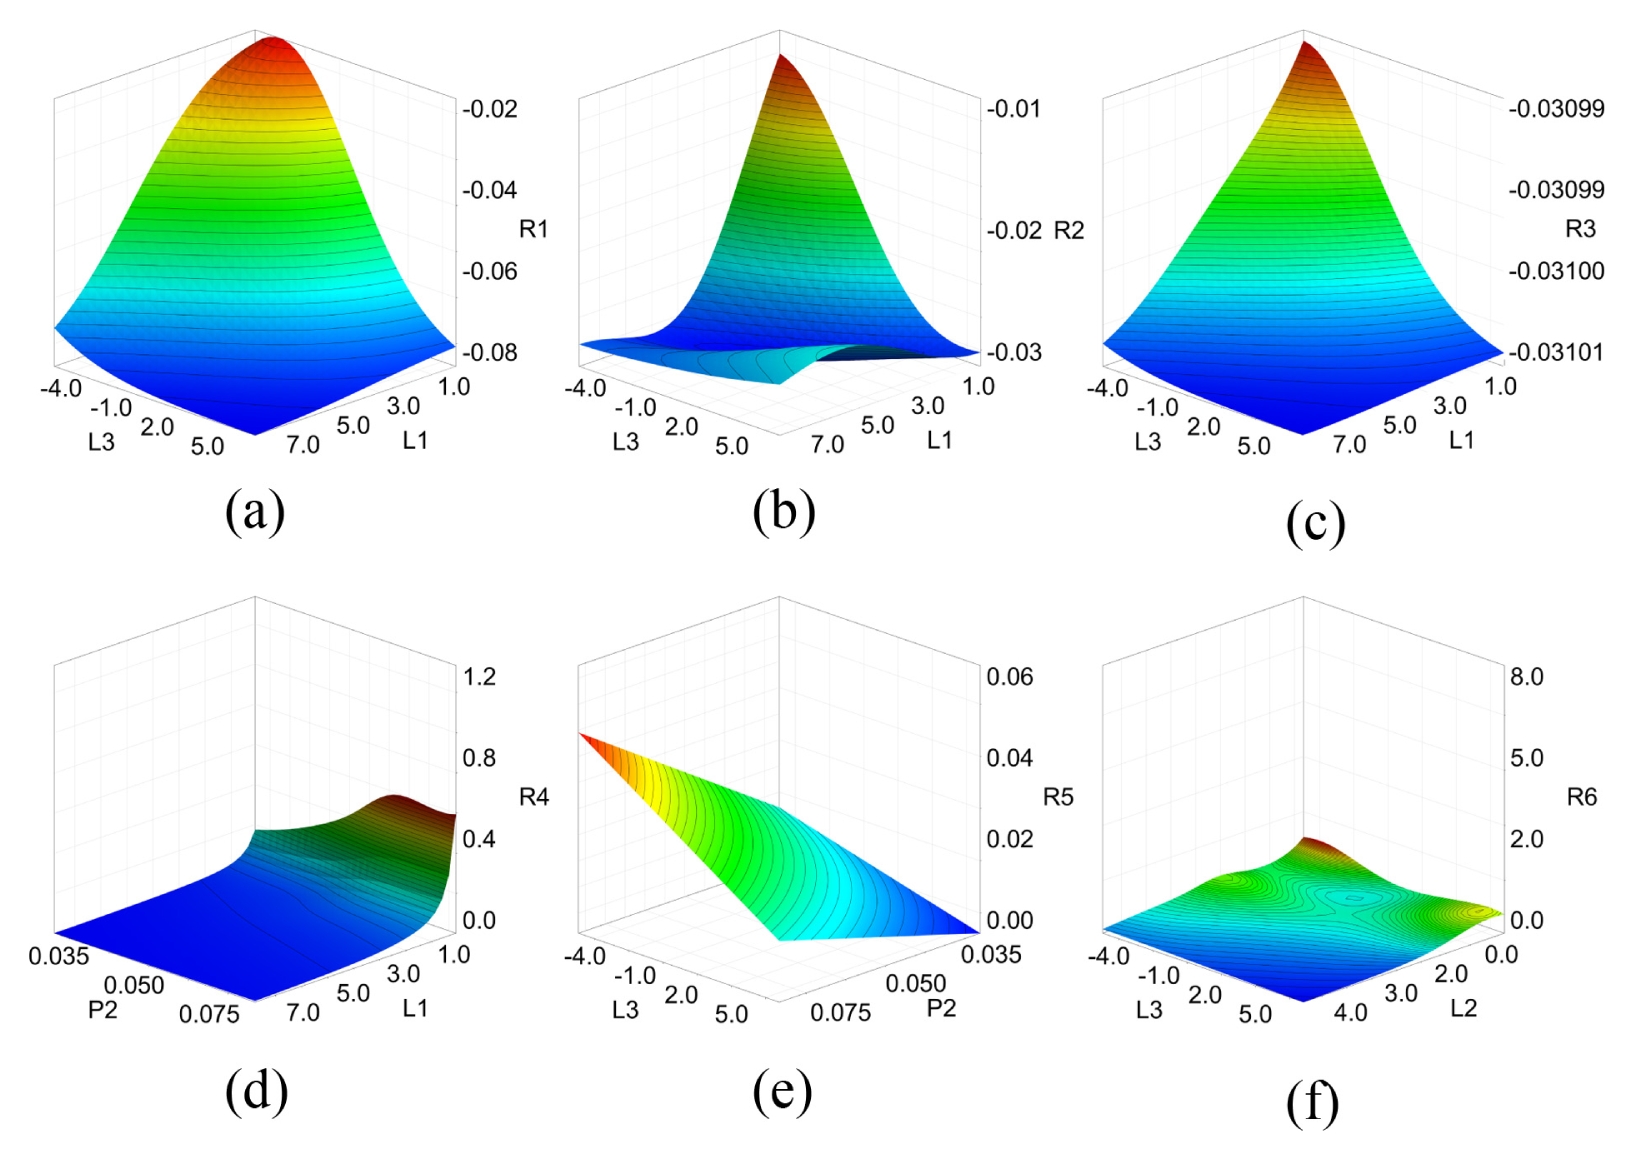
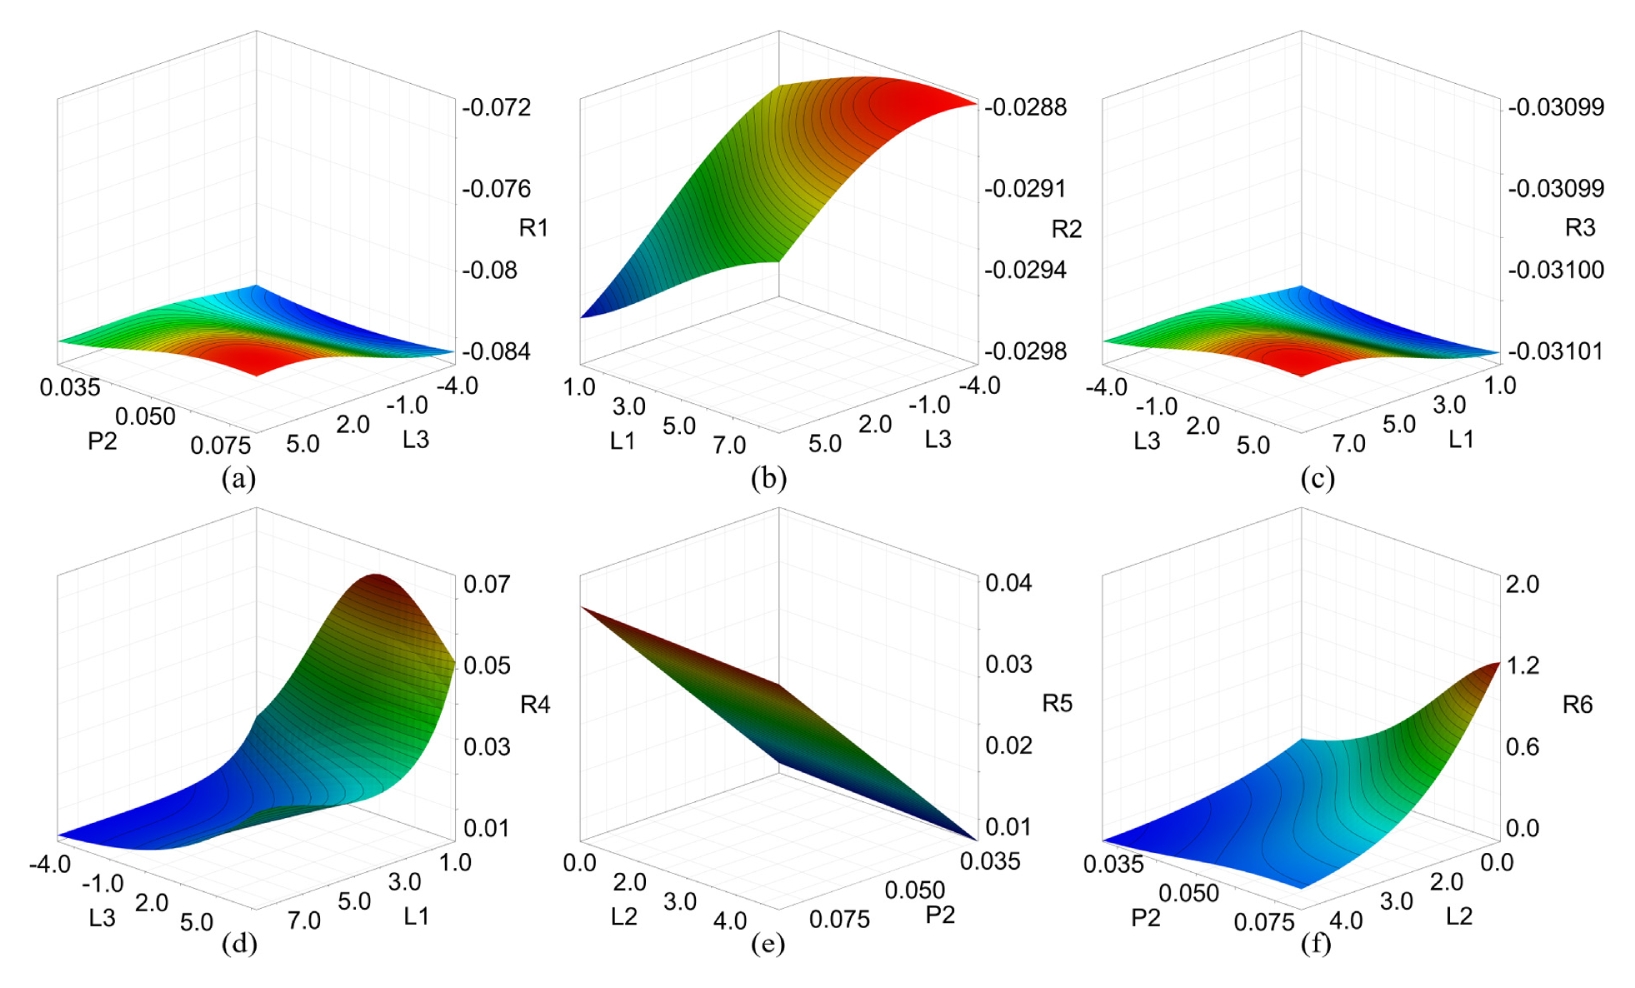
The response surfaces, outputs of the metamodel that serve as practical tools, are shown in
Figs. 7-
9. The shapes of the individual response surfaces showed similar trends.
Subsequently, the metamodel predictions were compared with the FEM analysis results at several design points, and the accuracy is presented in
Table 5. The prediction accuracies for LC, MC, and SC were 98.2%, 96.6%, and 97.5%, respectively. However, the prediction accuracy of R6 was relatively lower than the other response variables. As R6 corresponds to the maximum von-Mises stress acting on the NRR and is associated with structural safety, an additional analysis was performed to verify structural safety.
Multi-objective optimization was performed using multiobjective evolutionary algorithms (MOEA). MOEA integrated in OptiSLang is a stochastic global optimization method inspired by natural principles of adaptation, selection, and mutation. It represents multiple design solutions as a population and encodes them as genes. Through crossover and mutation operations, new candidate solutions are generated. The next generation is then formed around the most promising solutions, and this process is iterated to search for the optimal solution [
22].
MOEA was used with a population size of 10 and 1000 generations. The crossover and mutation probabilities were set to 50% and 25%, respectively. The optimization stopped after 20 generations without improvement or when the maximum number of samples was reached.
In general optimization problems, two or more objectives must be considered. Multi-objective optimization is needed to deal with the problems, and Pareto optimization was adopted to solve the multi-objective optimization. When multiple objectives conflict, Pareto optimization generates a set of non-dominated solutions, Pareto front in which no objective can be improved without degrading at least one other. Pareto optimization uses the following general formula [
23].
where X = (x1,x2,…,xn)T is the vector of design variables and gj(X) represents inequality constraints and hk(X) is equality constraints. Each solution x is mapped to a vector f(X) = Z = (z1,z2,…,zm)T representing a point in the objective space. Through this process, a Pareto frontier, which represents a set of non-dominated solutions in the objective space, is generated. This enables the comparison of alternative solutions and the selection of an optimal design.
3. Results and Discussions
3.1 Pareto Frontiers
Table 6 summarizes the criteria for Pareto optimization. The objectives were defined as: (1) MAX_AVER: minimizing the difference between the maximum and average normal stress, (2) MIN_AVER: minimizing the difference between the minimum and average normal stress, and (3) LONG_SHORT_PR: minimizing the average pressure difference between the short and long regions.
In addition, constraints were imposed to prevent deformation or failure of the retainer ring. A safety factor was applied to specify the maximum allowable von-Mises stress, thereby ensuring the structural integrity of the optimized design. The allowable stress of retainer ring is 76 MPa and the safety factor is set 4.0 [
24].
The first and second objective functions aim to achieve a uniform stress distribution on the wafer by minimizing the difference between the maximum or minimum stress and the average stress. If only one of these objectives is considered, the opposite stress value (either maximum or minimum) tends to increase. Therefore, both objectives must be considered together to ensure overall stress uniformity on the wafer.
The third objective function is related to regional wear imbalance in terms of NRR. Reducing the pressure difference between the short and long regions improves wear balance; however, this often leads to a loss of stress uniformity. As a result, the Pareto front is required to simultaneously consider all three objective functions.
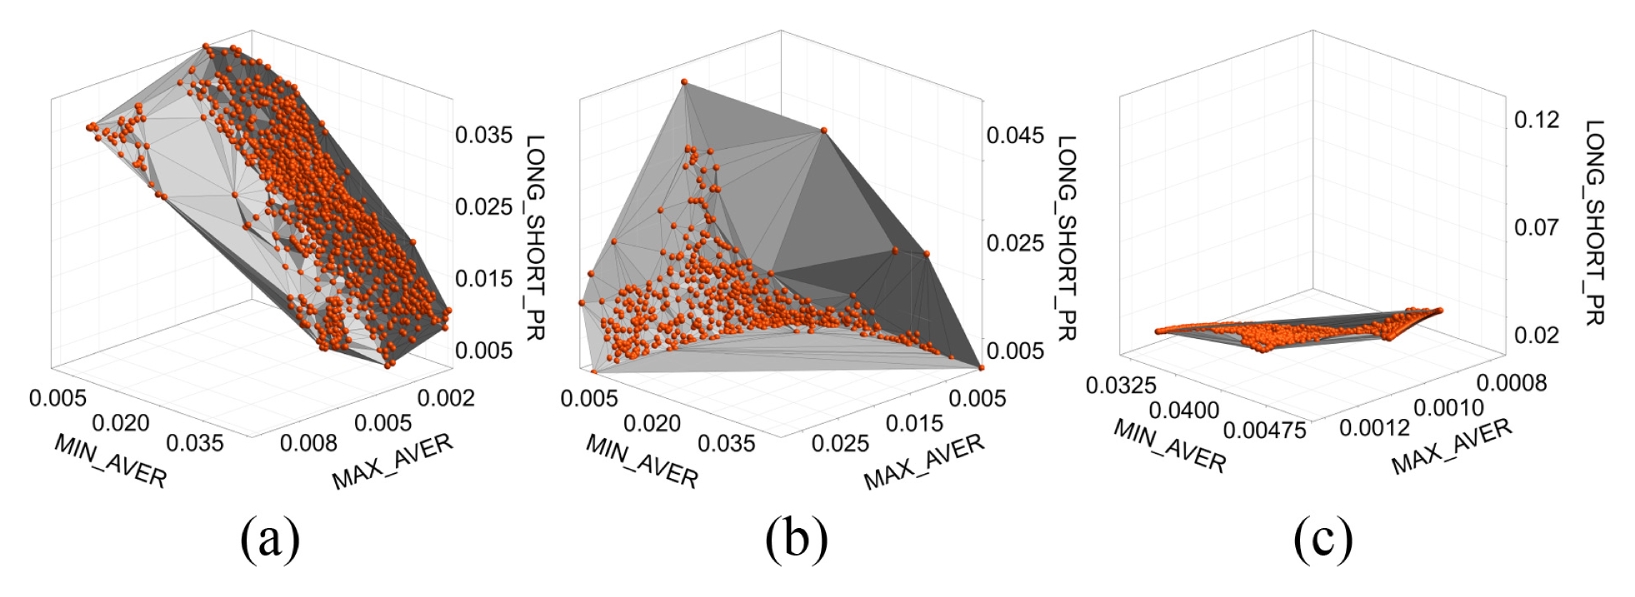
Pareto frontiers were obtained for each case and are shown in
Fig. 10. The Pareto fronts reveal that MAX_AVER and MIN_AVER exhibit a generally inverse relationship, such that improving one inevitably leads to the deterioration of the other. In addition, a three-way conflict is observed when considering LONG_SHORT_PR. Moving toward a more balanced pressure distribution between the short and long regions results in compromises in either MAX_AVER or MIN_AVER. Thus, improving balance often comes at the cost of reduced stress uniformity.
Although LONG_SHORT_PR was initially included as an objective to ensure that the model considered wear balance between the short and long regions while improving MRR uniformity, its values remained within a relatively small range across most Pareto solutions. Further reduction would only deteriorate either MIN_AVER or MAX_AVER. Therefore, LONG_SHORT_PR was not considered a decisive factor in the subsequent design selection process.
From the Pareto frontiers, three representative designs (De-signs 1, 2, and 3) were selected to analyze MRR and non-uniformity. Their parameter values are provided in
Table 7. Design 1 corresponds to the case minimizing MAX_AVER, Design 2 minimizes MIN_AVER, and Design 3 represents a balanced case where both metrics are comparable.
The wafer-scale MRR model proposed by Lee et al. [
12] was employed to calculate the MRR distribution. Since chemical reactions were not included in this study, the equation was simplified, and the resulting form is given in
Eq. (6).
Where k, P, and Vre. avg are Preston coefficient, pressure, and relative velocity between the wafer and the polishing pad, respectively. σn(x,y) represents the normal contact stress.
The wafer-scale MRR distribution based on the normal contact stress was calculated using the simplified equation. The wafer pressure was set to 31 kPa, and the rotational speeds of both the carrier head and the platen were set to 60 rpm. In rotary-type CMP, the relative velocity distribution across the wafer can be derived from kinematic analysis. The relative velocity at the arbitrary position on the wafer was calculated by
Eq. (7) [
25].
where V→ represents the relative velocity at an arbitrary position on the wafer with respect to the platen. The terms V→h and V→p denote the corresponding absolute velocities on the wafer and platen. r→h and r→p indicate the vectors drawn from the same position to the wafer and platen centers, while r→hp specifies the offset vector between the two centers. ω→h and ω→p describe the angular velocities of the head and platen, respectively. To isolate the influence of normal stress and eliminate the effect of velocity distribution on MRR, the platen and head were rotated at the same speed, resulting in a constant relative velocity across the wafer.
Since the optimal design cannot be quantitatively determined from the MRR distribution alone, the non-uniformity of MRR was evaluated as a performance metric. It was calculated using the
Eq. (8) [
6].
Where
MRRstd and
MRRavg are the standard deviation and average of MRR.
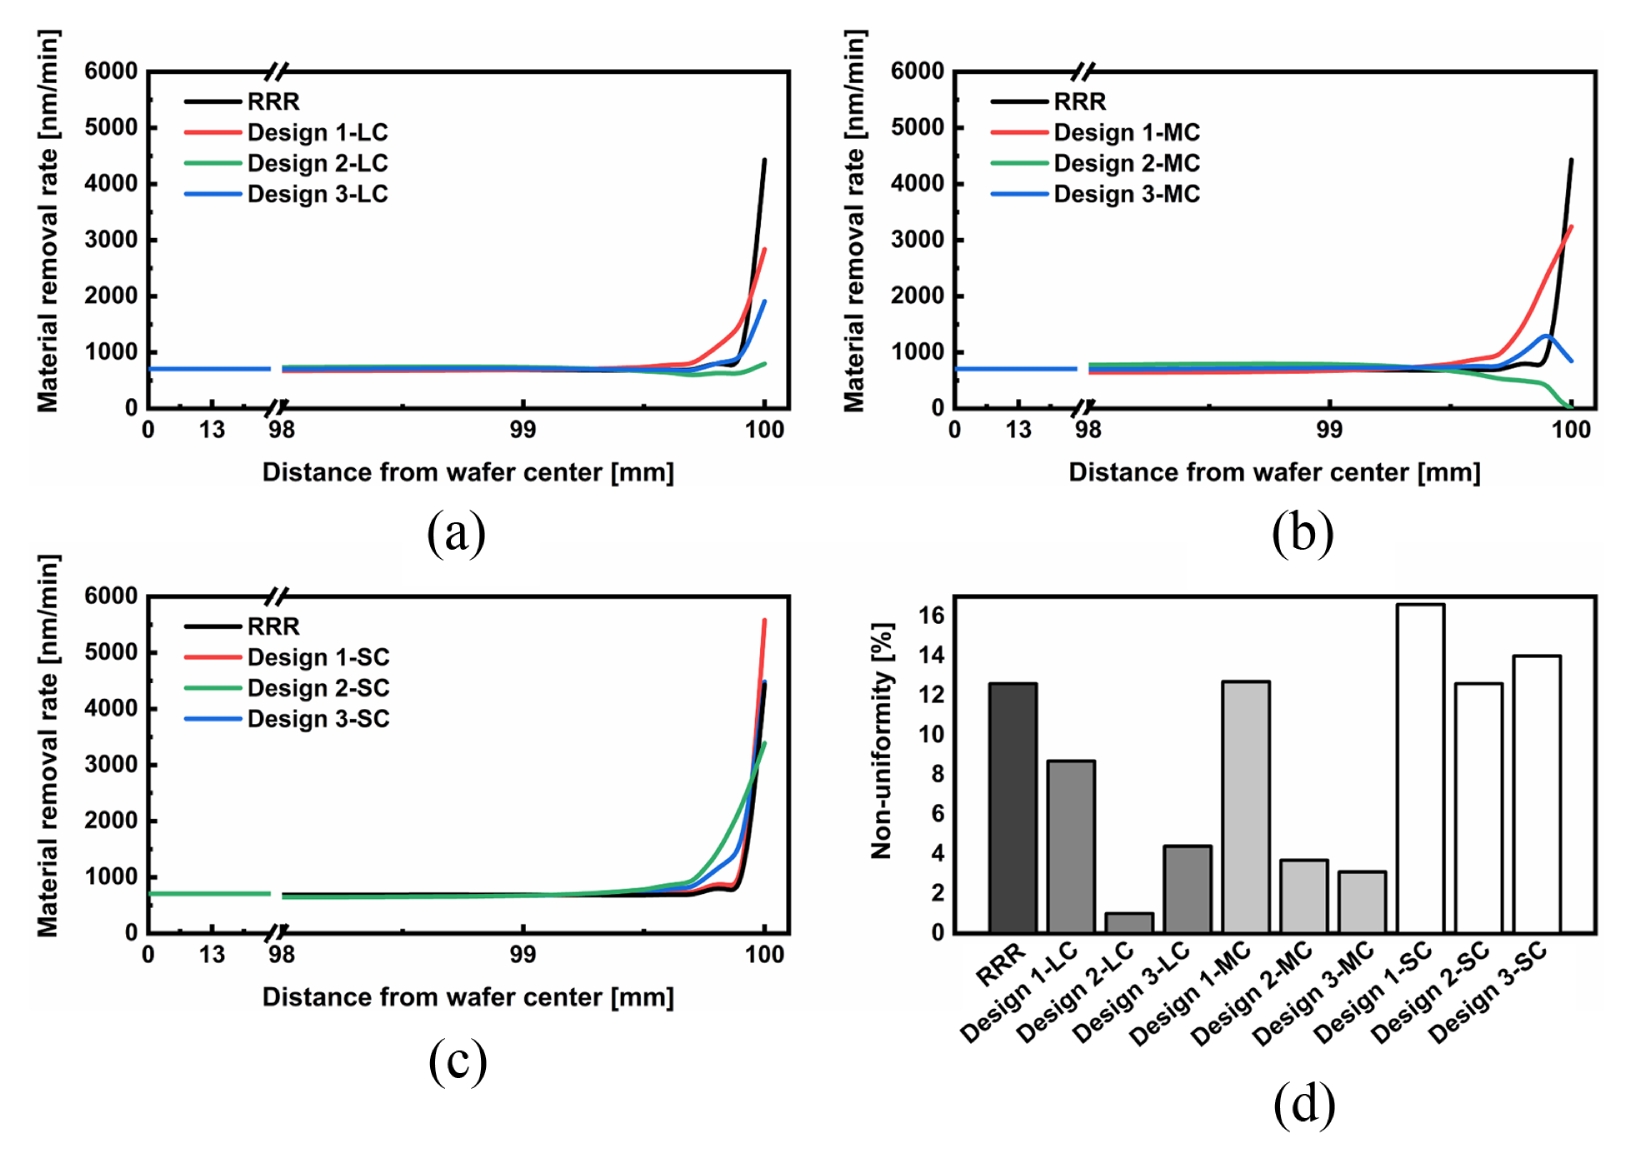
Fig. 11 shows the MRR distribution and the corresponding non-uniformity for each case. Design 1, which minimized the objective value of MAX_AVER, exhibited the poorest performance across all cases.
Since the calculated normal stress was compressive, MAX_AVER represents the absolute difference between the minimum and the average normal stress. However, because stress concentrations tend to occur under such conditions, Design 1 is not appropriate to be considered as a primary objective in multiobjective optimization. In contrast, Design 2, which minimized the objective value of MIN_AVER, and Design 3, where both objective values were balanced, were identified as more suitable candidates for determining the optimum design.
3.3 Structural Stability
In each case, the best designs, Design 2-LC, Design 3-MC, and Design 2-SC were selected to analyze the deformation and von Mises stress of the retainer ring based on the MRR distribution and its non-uniformity.
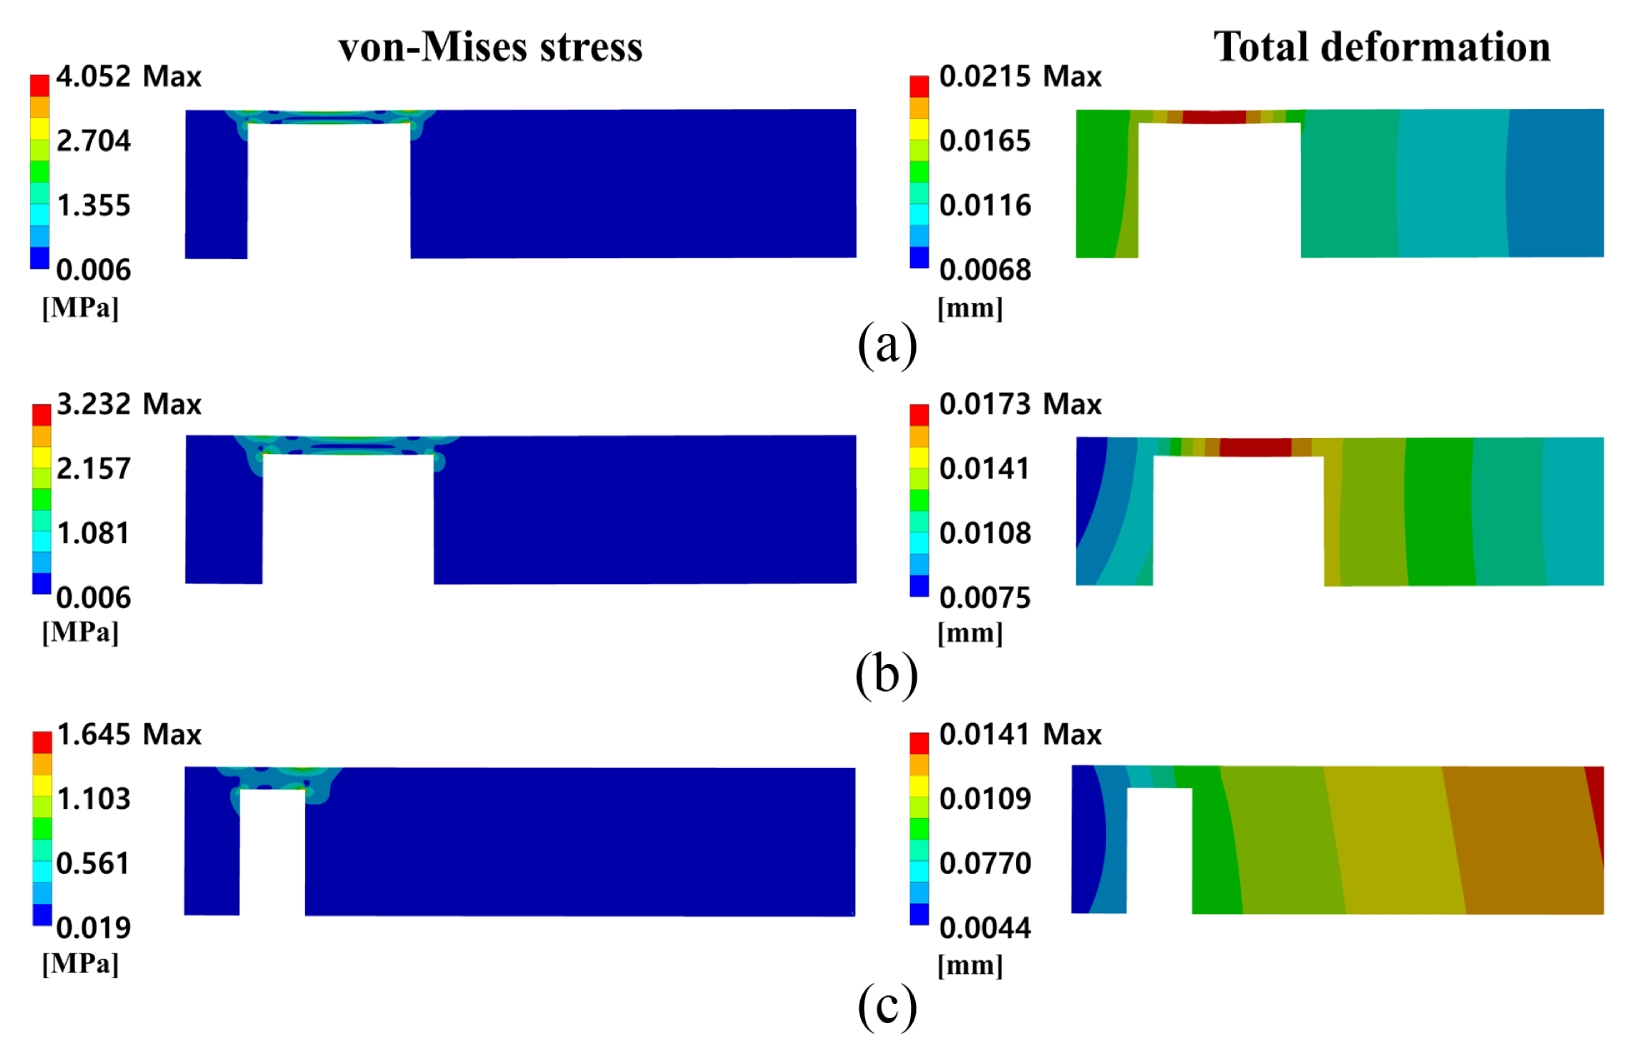
Fig. 12 shows the von Mises stress field and total deformation of the retainer ring for each design. The maximum von Mises stress was lower than the allowable limit, confirming that all designs satisfied the structural criteria.
High-stress regions consistently appeared in the thickness area, and the maximum stress values increased in the order of Design 2-LC, Design 3-MC, and Design 2-SC. This trend was influenced by both the thickness and the size of the pressing area. Specifically, LC exhibited the smallest thickness, whereas SC had the greatest thickness. As thickness decreased, deformation became more pronounced, which in turn led to higher stress.
This finding was also consistent with the results of the sensitivity analysis: in the CoP matrix, the single CoP value of L2 was the largest, indicating that thickness had the strongest influence on stress variation. Moreover, in LC and MC, pressure was applied directly to the thin region, causing significant deformation in the thickness area. By contrast, in SC, pressure was not applied directly to the thickness region, which reduced deformation and consequently limited stress generation.
Nevertheless, the maximum stress values in all cases remained far below the yield strength of the retainer ring, demonstrating that the selected designs were structurally safe.
3.4 Optimal Design Selection
For all designs in the LC, both the maximum normal stress and the non-uniformity of the MRR were lower than those in the RRR. Among them, Design 2-LC exhibited the flattest wafer-scale MRR distribution, indicating its effectiveness in mitigating stress concentration and improving MRR uniformity. Similarly, all MC designs showed lower maximum normal stress and non-uniformity compared to the RRR. Within the MC, Design 3-MC provided the most uniform MRR, although its performance was still inferior to that of Design 2-LC. By contrast, both Design 1-SC and Design 3-SC exhibited higher maximum normal stress and non-uniformity than the RRR, while Design 2-SC also performed worse than the optimal designs of LC and MC.
As described previously, the retainer ring not only prevents the wafer from slipping out but also shifts the stress near the wafer edge to itself and can achieve a more uniform stress distribution [
25]. SC and MC are required to transfer stress from regions farther away from the wafer and therefore demand relatively higher pressure. This tendency was consistently observed in the optimal designs as well, where the optimal SC and MC were found to have greater pressure values than the LC. In SC, the pressure even reached the maximum limit, which puts extra load on the CMP equipment and shortens its lifetime.
In addition, even under the same pressure, MC and SC applied greater force than LC because of their smaller pressing areas. For these reasons, SC and MC were considered unsuitable. Among the selected designs, Design 2-LC showed the flattest MRR distribution and the lowest non-uniformity and was therefore chosen as the best design.
4. Conclusion
In this study, the NRR was proposed and optimized by coupling FEM with a metamodel to improve MRR uniformity in rotary CMP using 8-inch wafers. To reduce computational cost while maintaining accuracy, a MOP was constructed with LHS–based DoE and refined using AMOP until the target CoP was achieved. Multi-objective optimization was then performed using Pareto optimization, and Pareto fronts were generated for LC, MC, and SC. Representative designs were evaluated based on the MRR distribution and its non-uniformity.
Design 1 consistently showed inferior performance; therefore, Design 2 and 3 were considered more appropriate. For both LC and MC, all designs reduced the maximum normal stress and MRR non-uniformity compared with the RRR. Among them, Design 2-LC exhibited the flattest MRR distribution and the lowest non-uniformity. In contrast, SC degraded performance. Consequently, Design 2-LC was identified as the optimal design, effectively mitigating stress concentration and MRR nonuniformity while satisfying the safety constraint.
This metamodel-based approach provides an efficient pathway for retainer-ring design optimization and shows potential for broader application in CMP. In practical CMP systems, the pressing force is usually applied by air pressure, and the pressing area can be controlled using a membrane with different pressure zones. By changing the pressure in each zone, the MRR behavior can be changed. The influence of the simulation-derived design and the pressing area on actual wafer-level MRR will be explored in future work.
FOOTNOTES
-
ACKNOWLEDGEMENT
This work was supported by the National Research Foundation of Korea(NRF) grant funded by the Korea government(MSIT). (No. RS-2023-00213741). This research was supported by Siltrax Co., Ltd. This research was supported by DRC Tech.
Fig. 1Schematic diagram of the CMP and the NRR
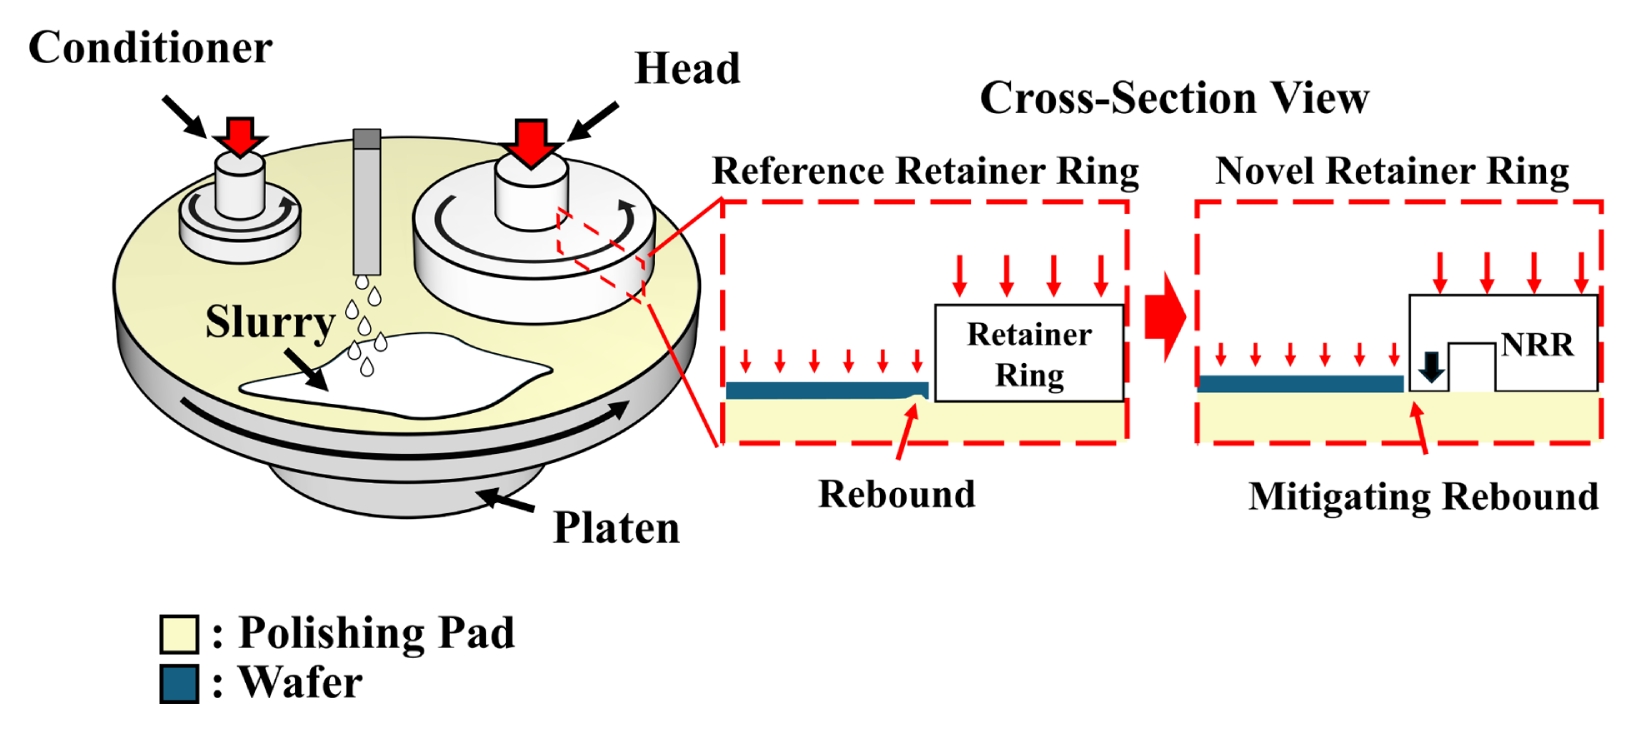
Fig. 2Flow chart of the optimization process
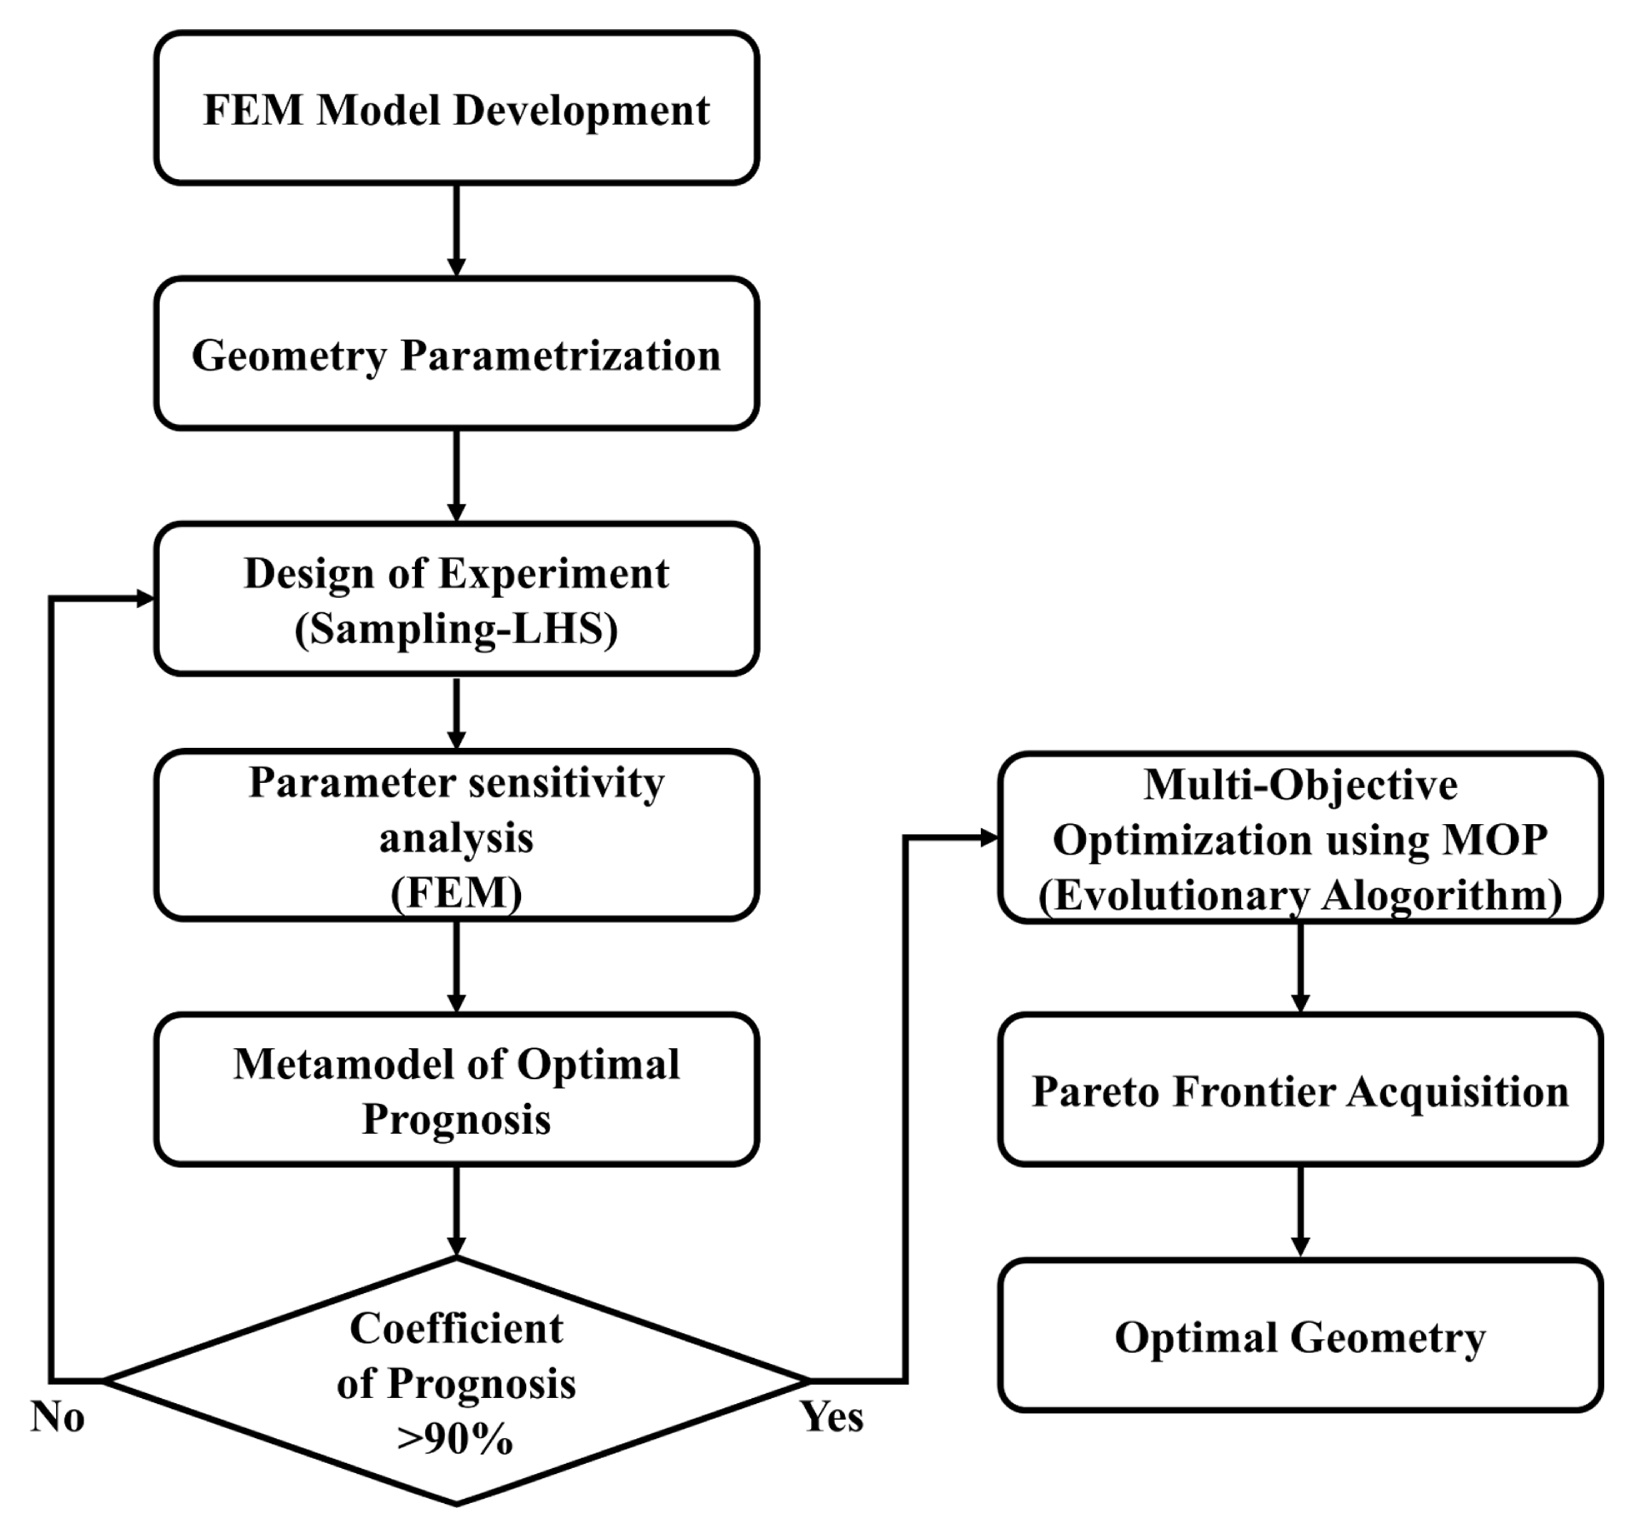
Fig. 3Schematic diagram of 2D axisymmetric static model with explanations of each case and parameters
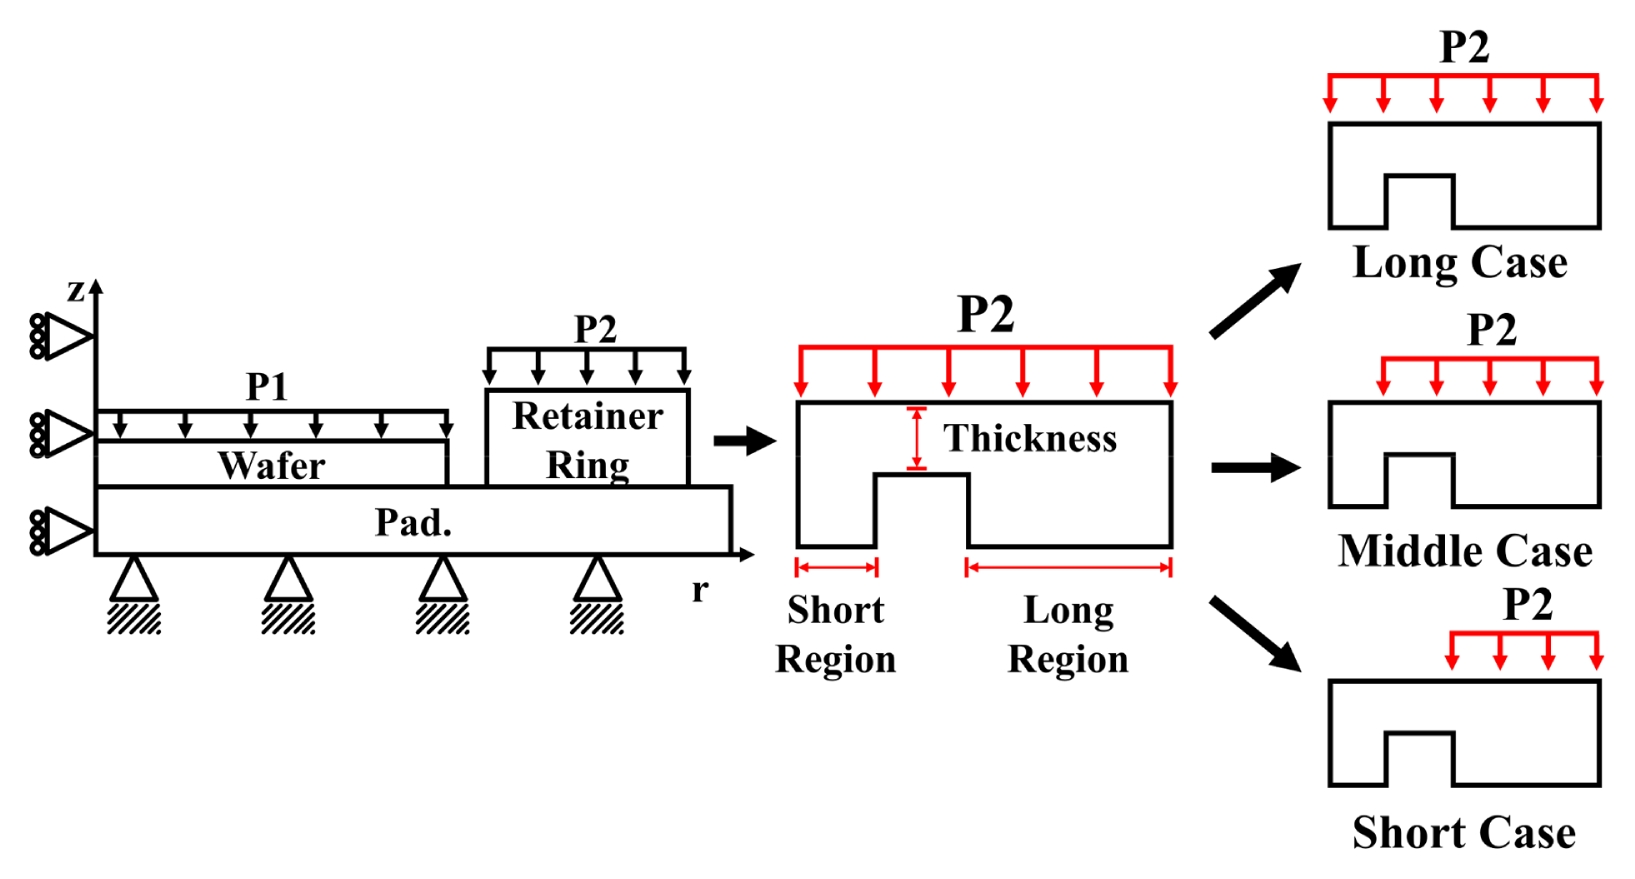
Fig. 4Mesh independent test of model
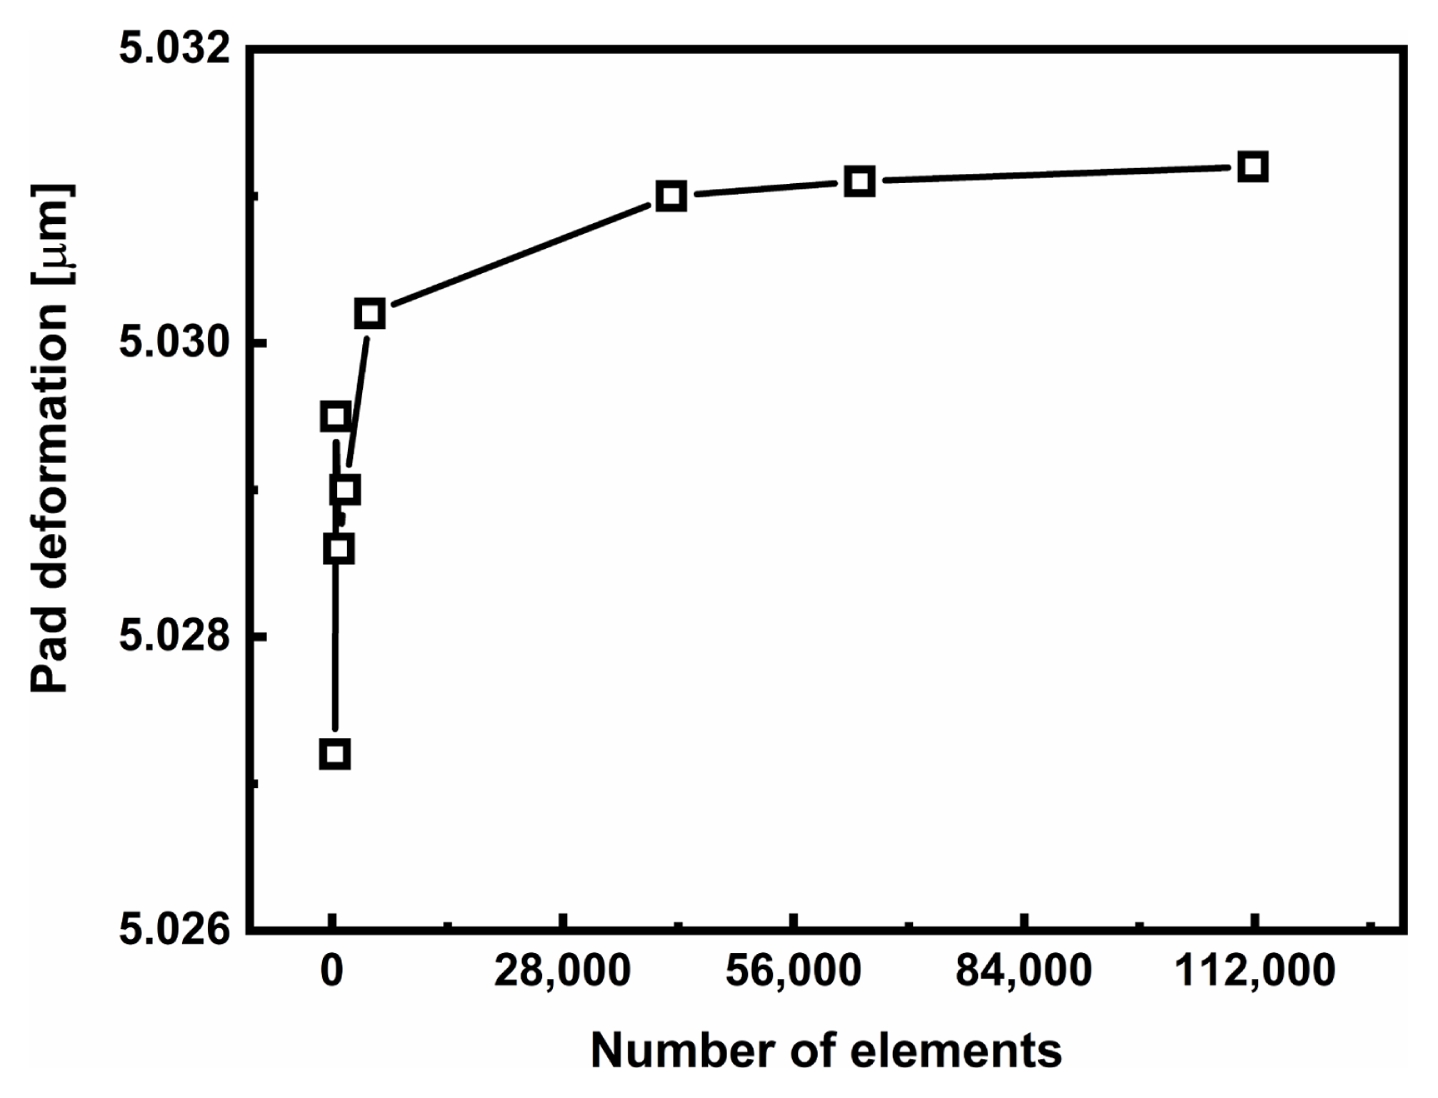
Fig. 5von-Mises stress distribution in the 2D axisymmetric static model
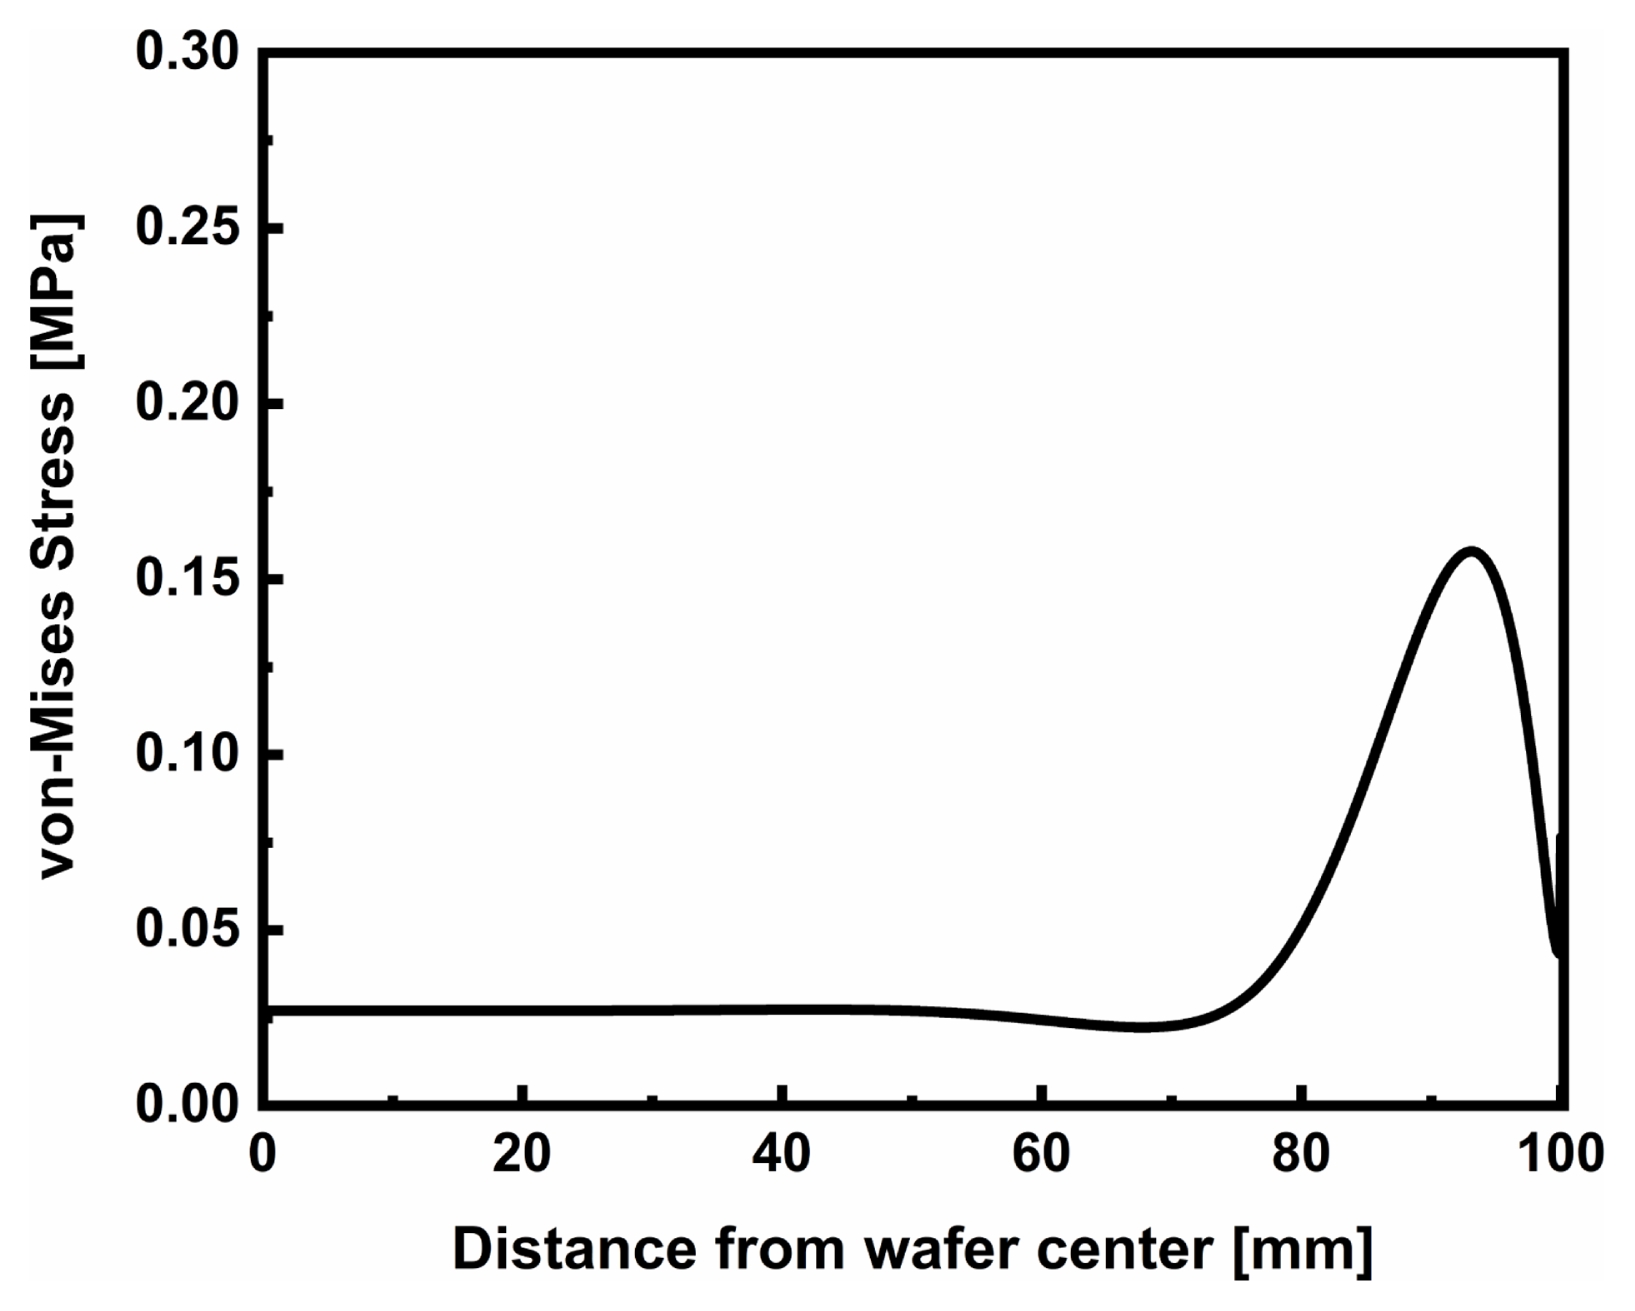
Fig. 6The von-Mises stress distribution for the RRR and NRR
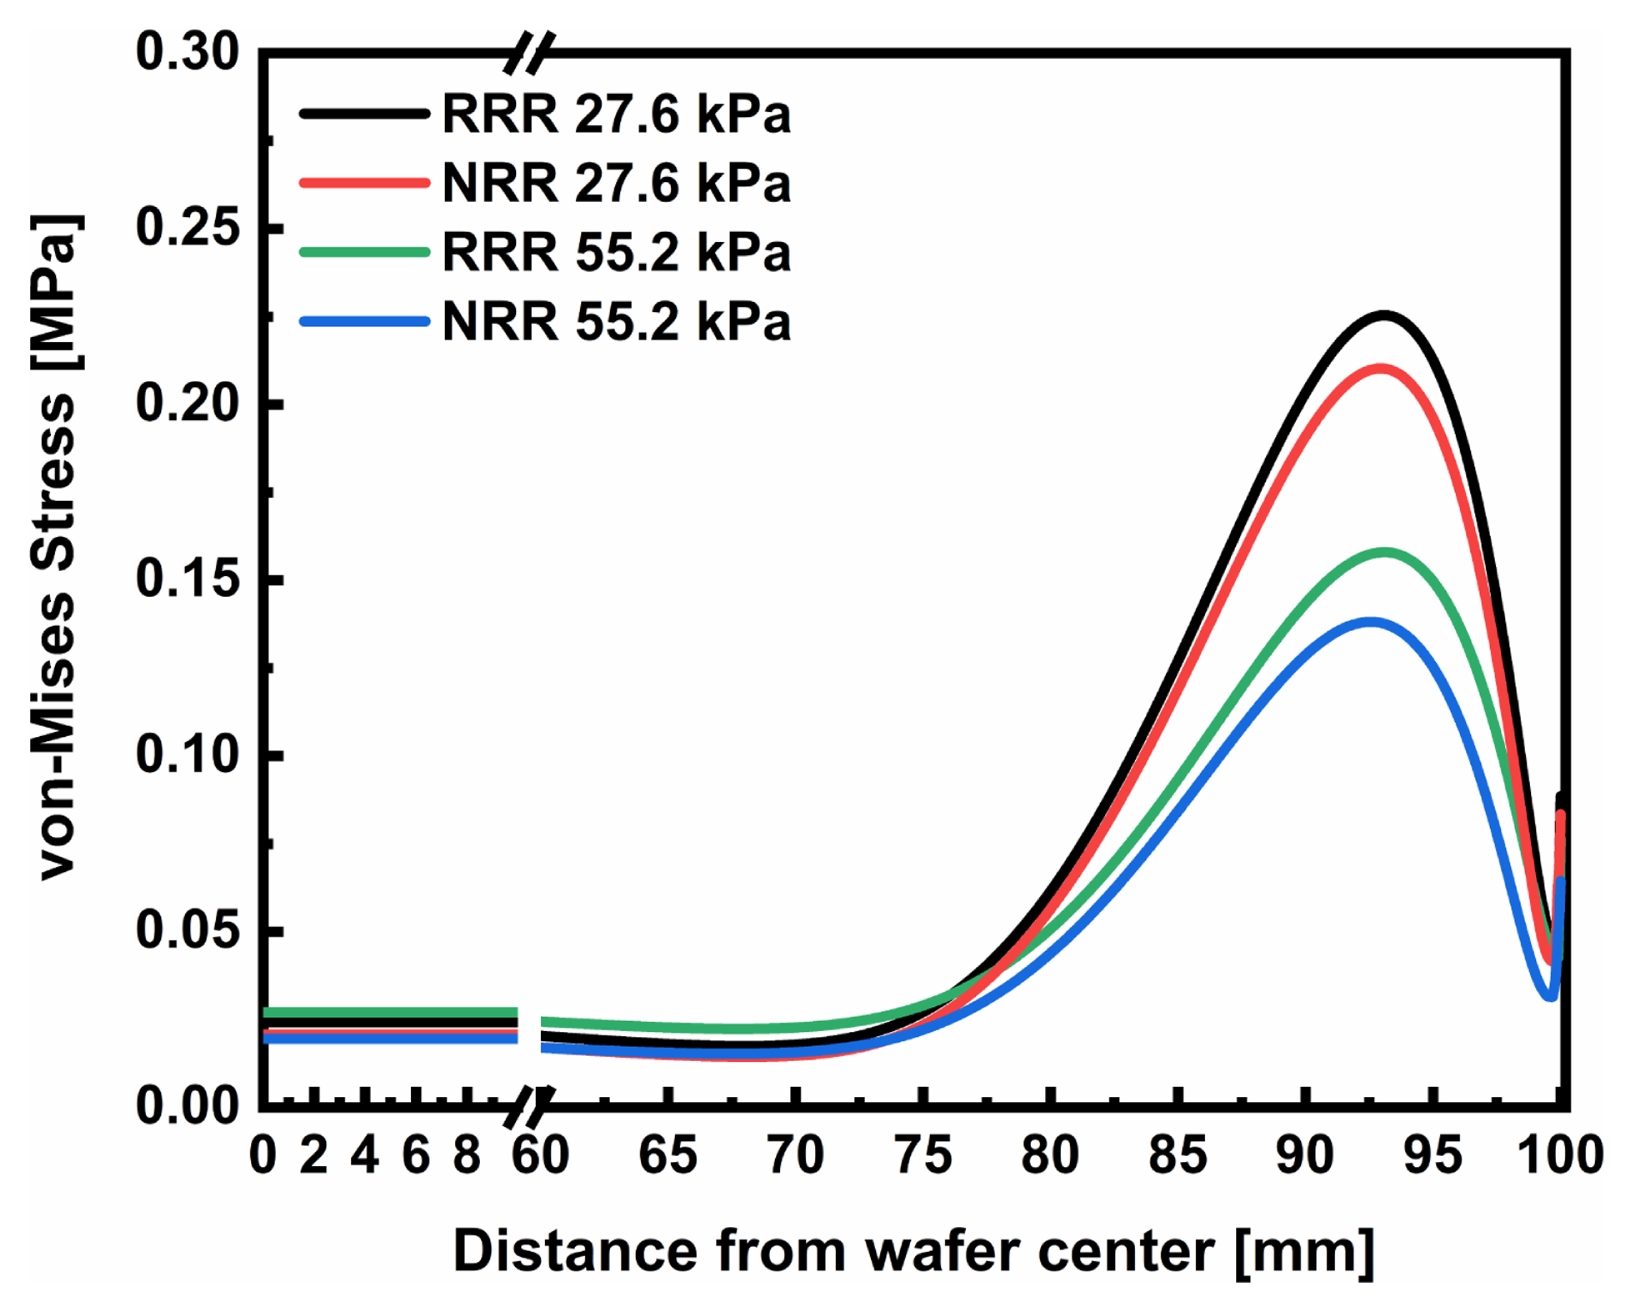
Fig. 7In the LC, response surface of (a) R1, (b) R2, (c) R3, (d) R4, (e) R5, and (f) R6
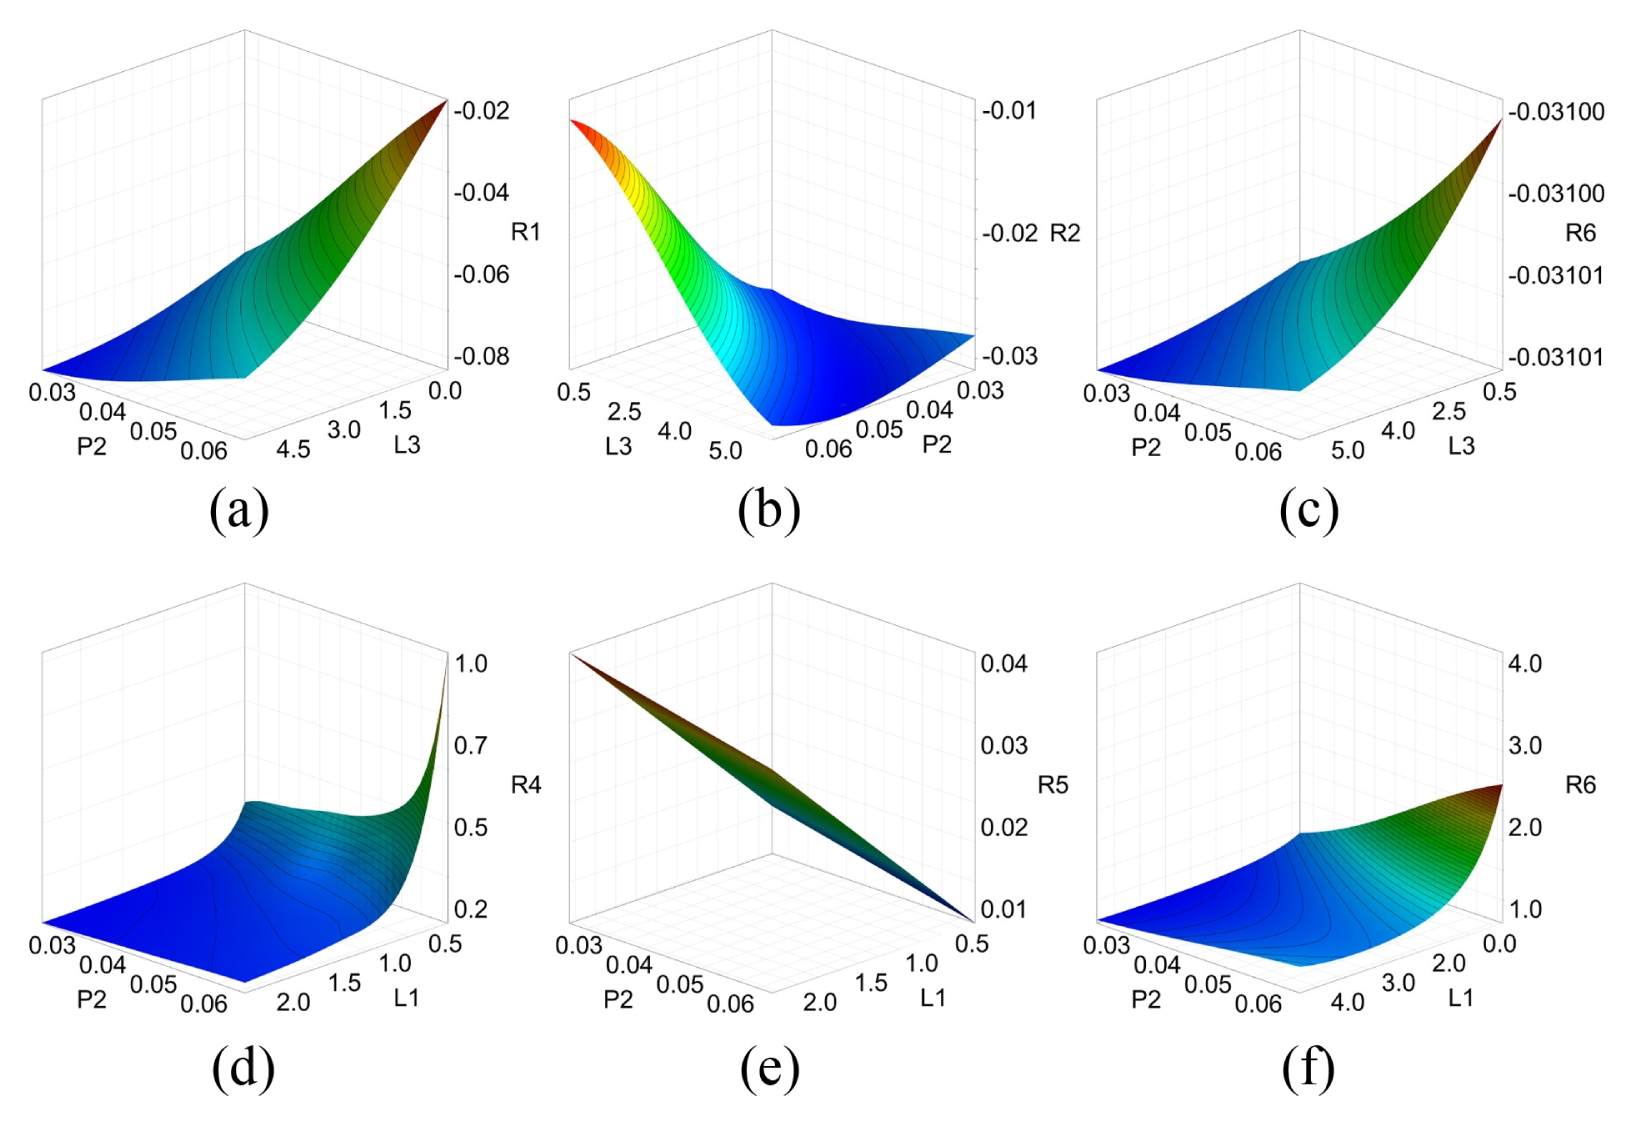
Fig. 8In the MC, response surface of (a) R1, (b) R2, (c) R3, (d) R4, (e) R5, and (f) R6
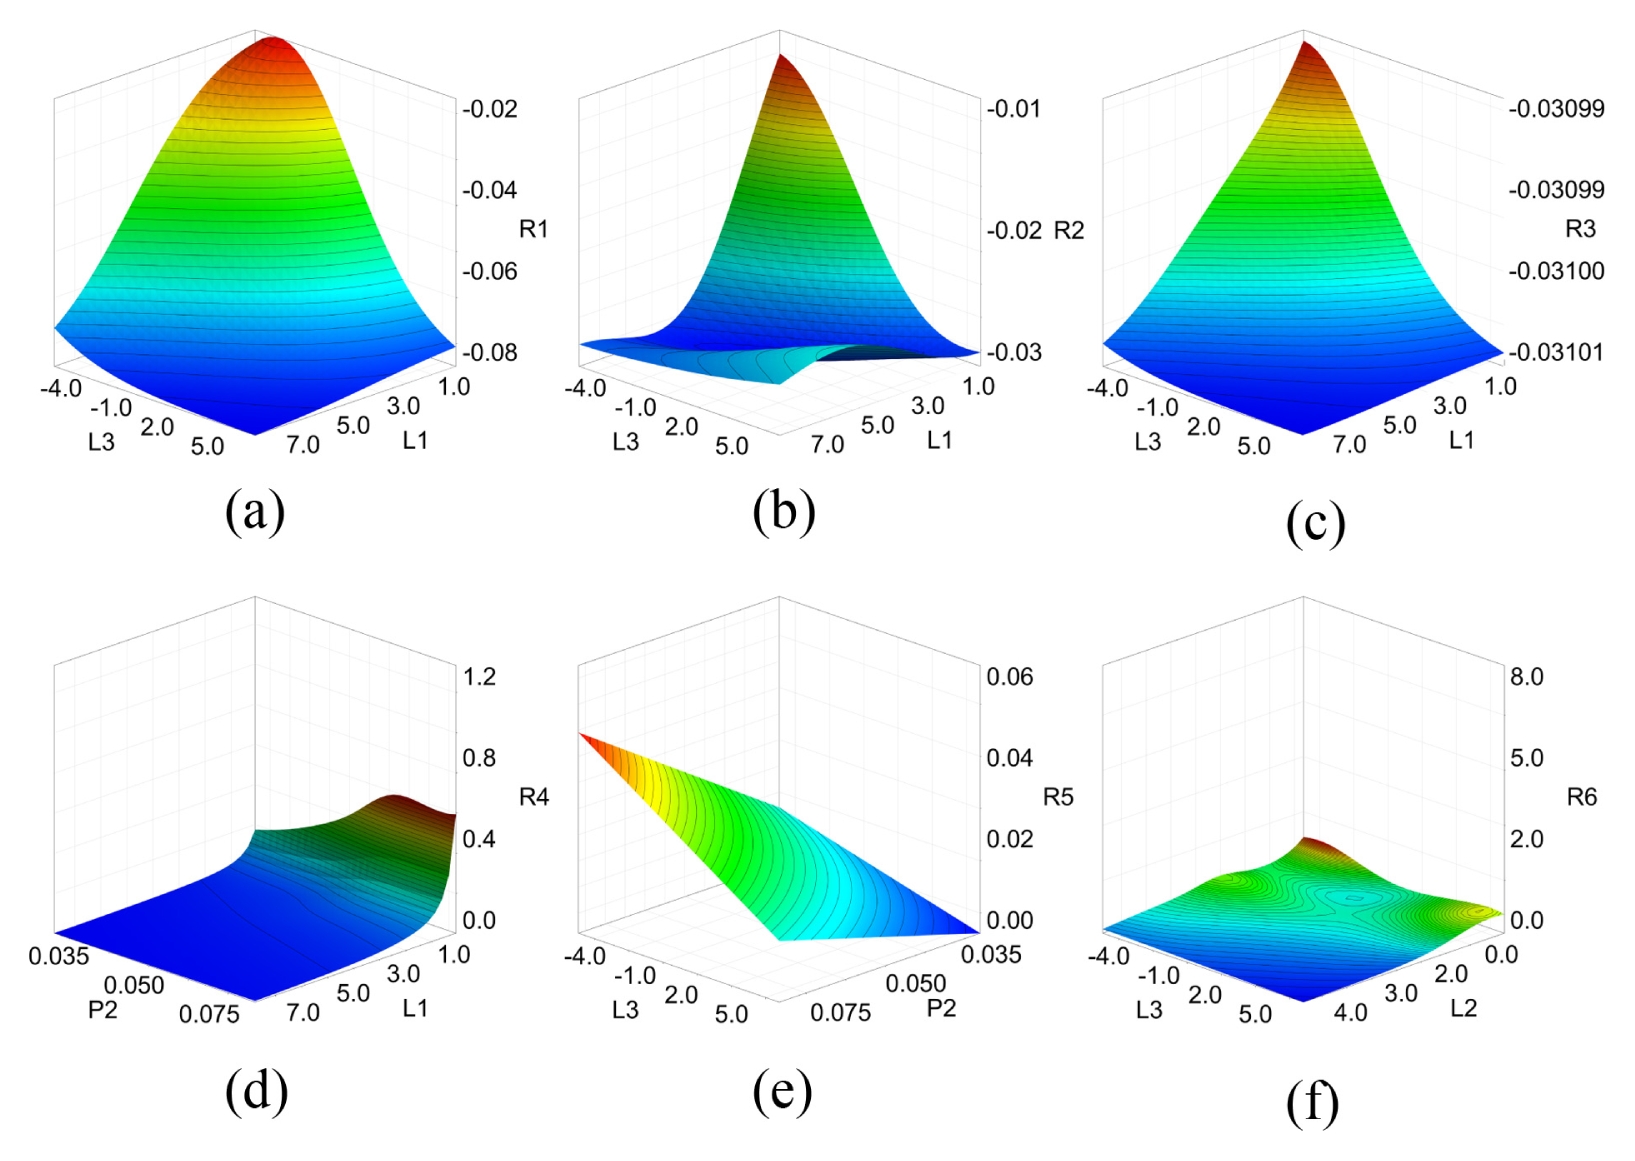
Fig. 9In the SC, response surface of (a) R1, (b) R2, (c) R3, (d) R4, (e) R5, and (f) R6
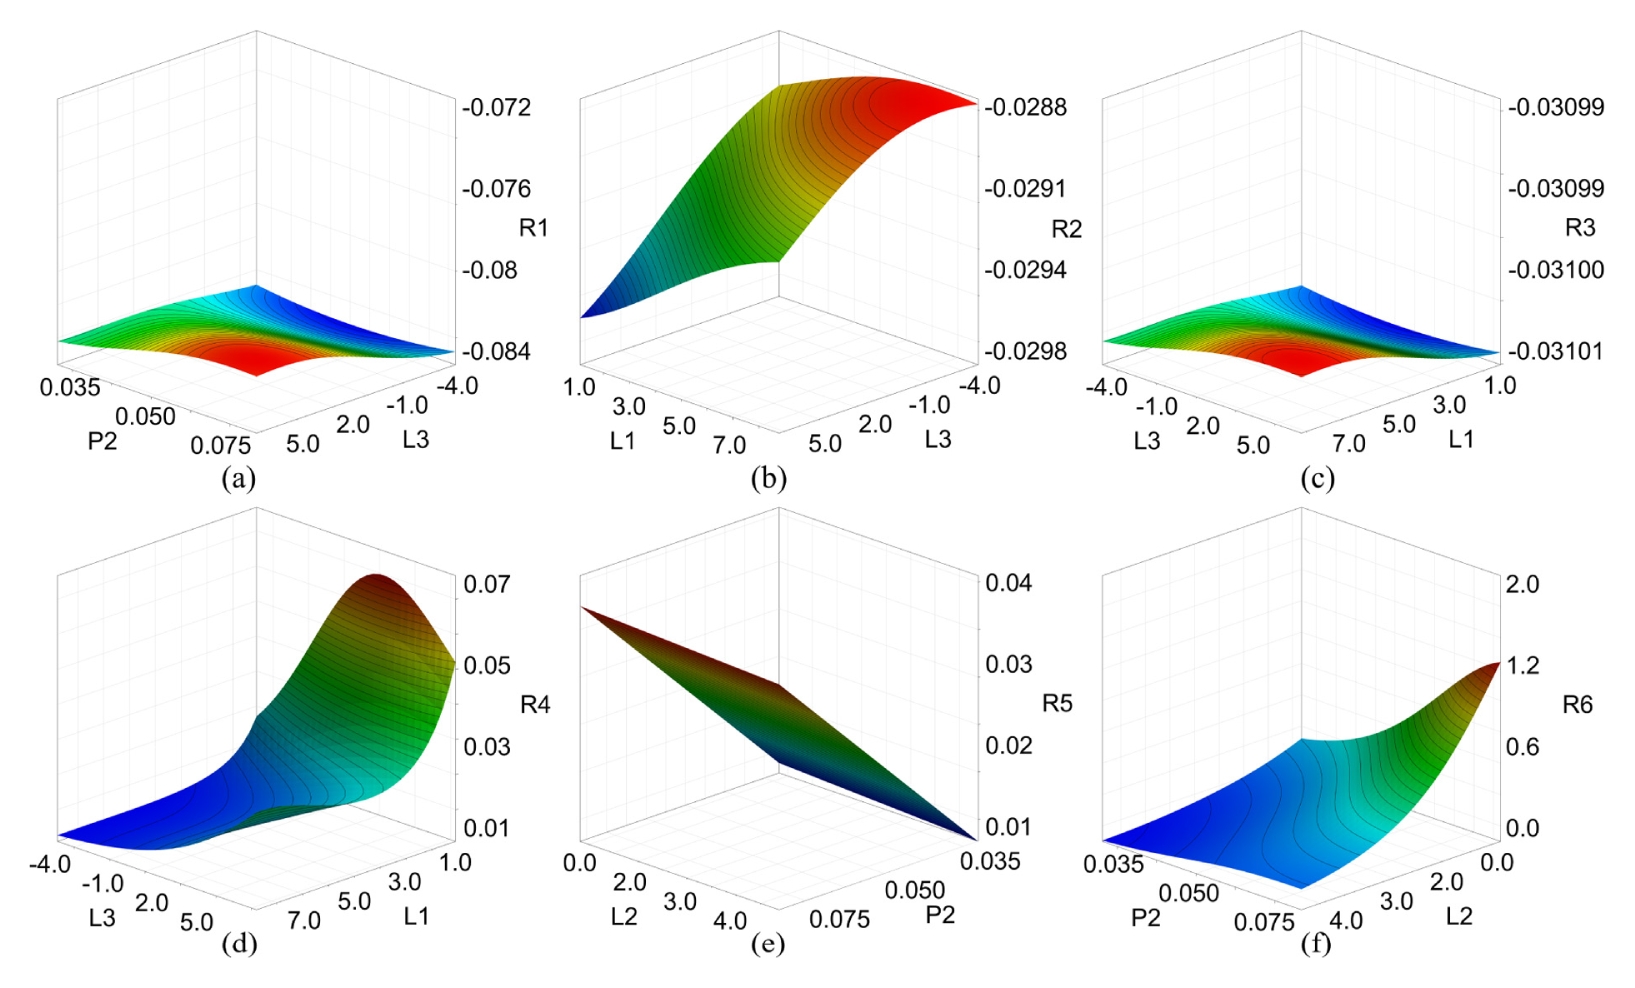
Fig. 10Pareto frontiers obtained for each case (a) LC, (b) MC, (c) SC
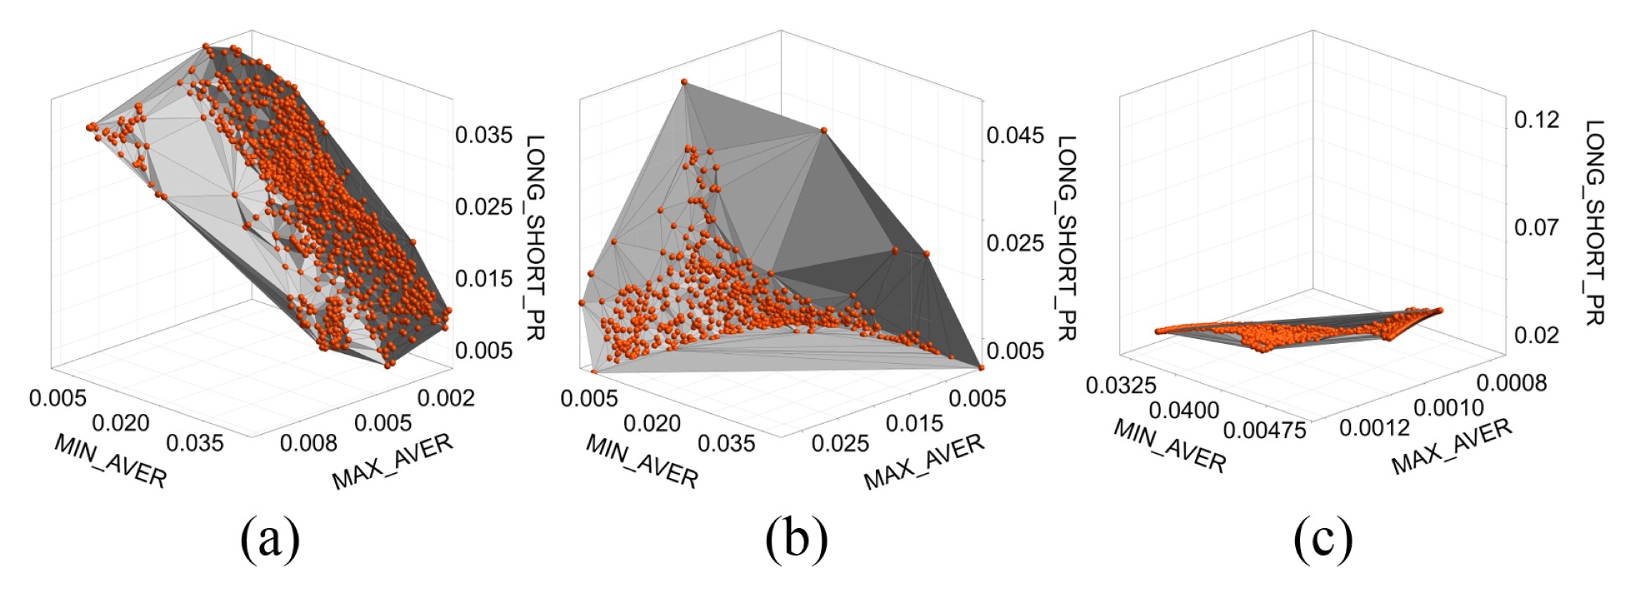
Fig. 11The MRR distribution of (a) LC, (b) MC, (c) SC, and (d) non-uniformity of MRR distribution for each case
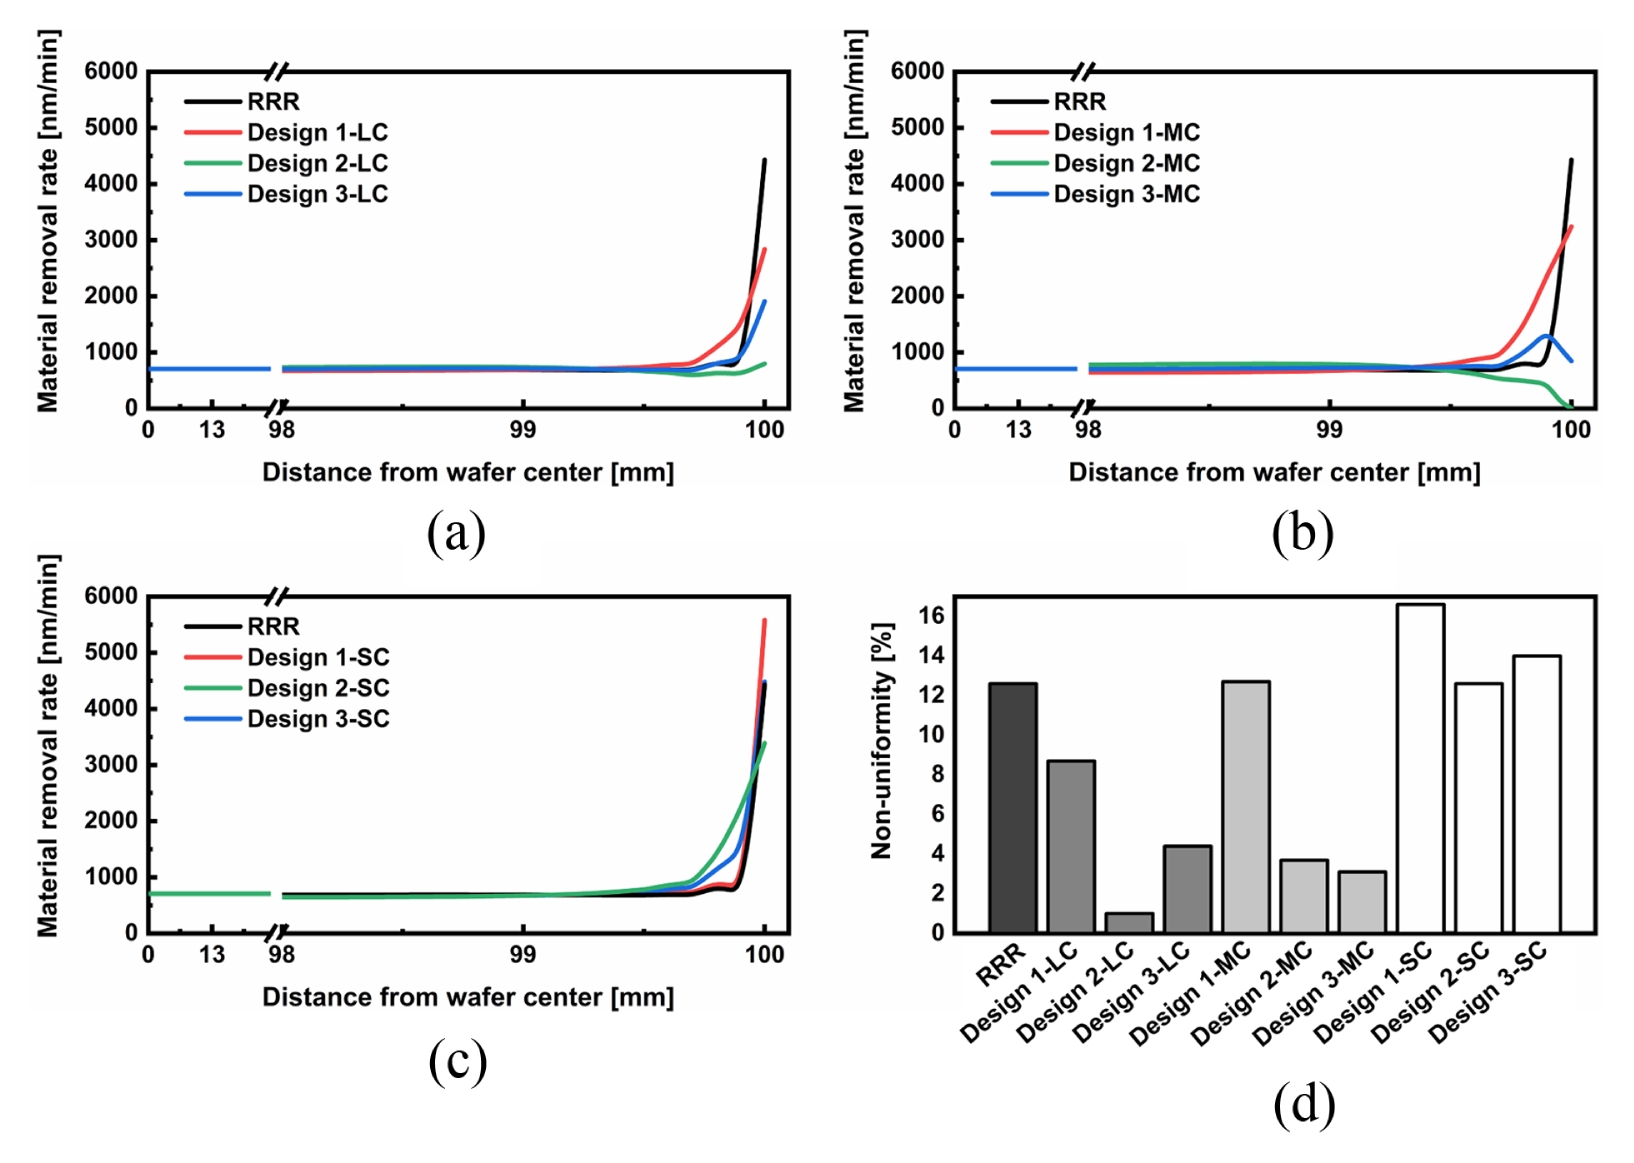
Fig. 12von-Mises stress field and total deformation over the retainer ring of each case (a) Design 2-LC, (b) Design 3-MC, and (c) Design 2-SC
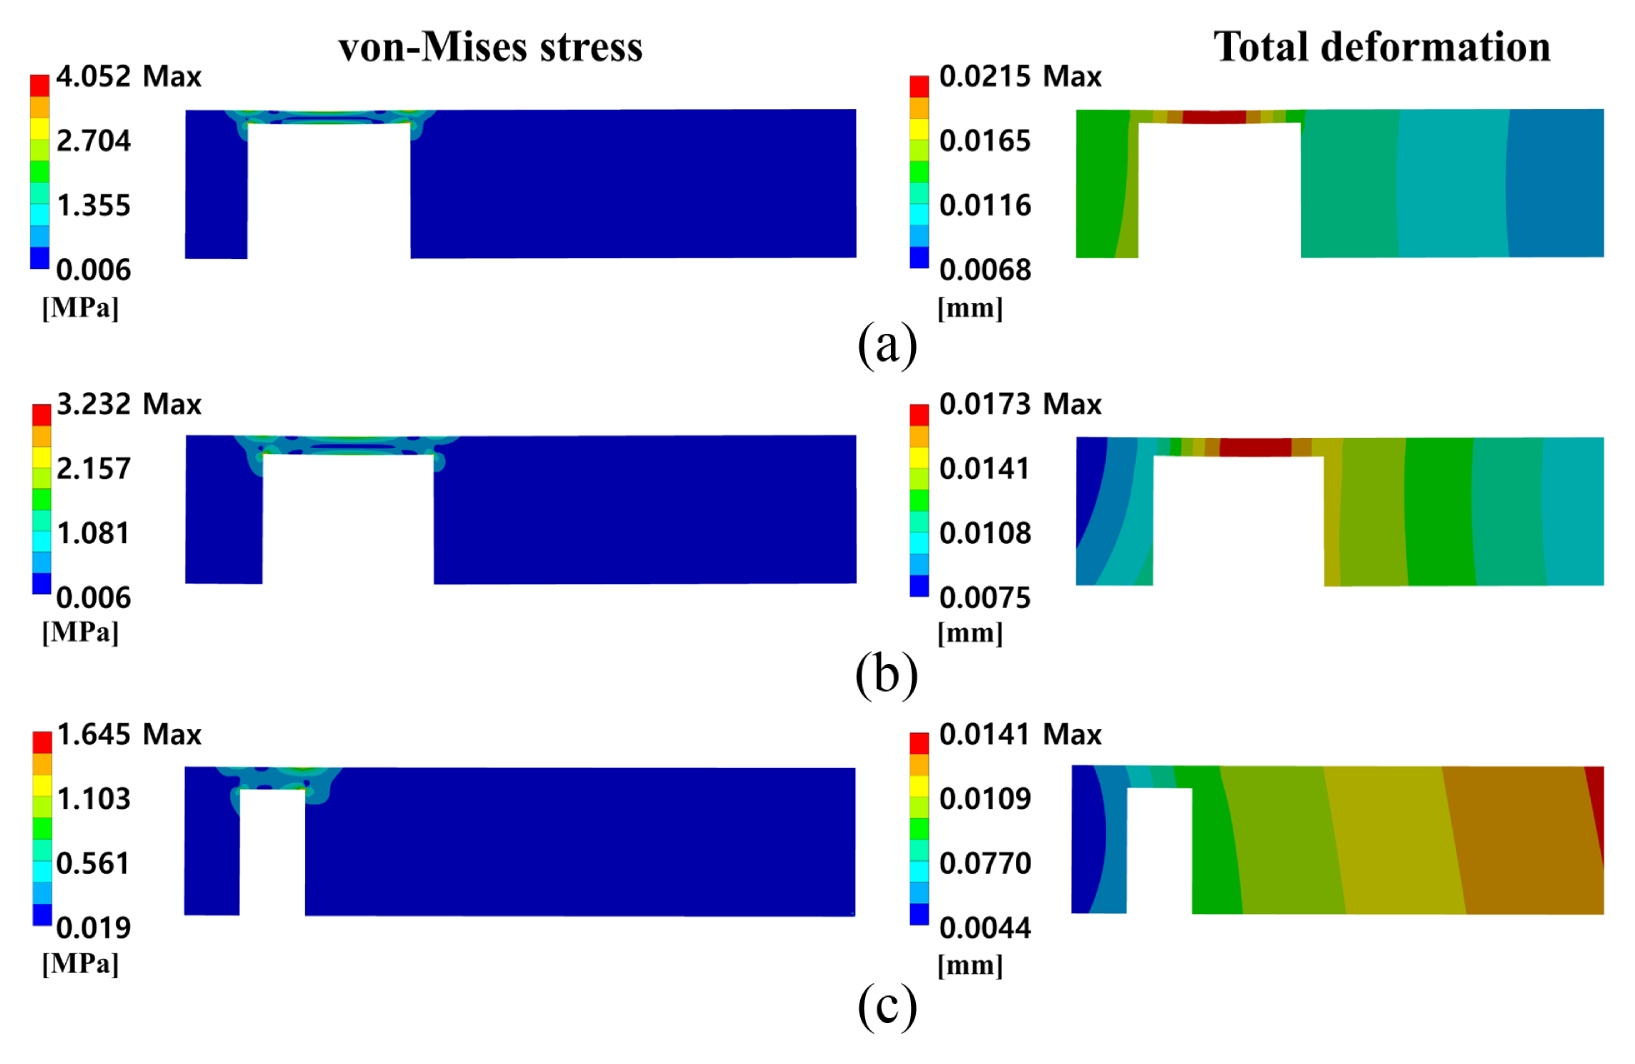
Table 1
Table 1
|
Young’s modulus [MPa] |
Poisson’s ratio |
|
Retainer ring |
3,600 |
0.4 |
|
Polishing pad |
12.4 |
0.1 |
|
Wafer |
160,000 |
0.3 |
Table 2Comparison of deformation between experiment and simulation
Table 2
|
Experiment |
Simulation |
Error |
|
No rebound region |
5.0e-3 |
5.017e-3 |
0.3% |
|
Press region |
1.0e-3 |
0.999e-3 |
0.1% |
Table 3Optimization parameters and range
Table 3
|
Name |
Variable type |
MIN |
MAX |
Unit |
|
P2 |
Continuous |
31 |
82 |
kPa |
|
Short |
Continuous |
0.1 |
18 |
mm |
|
Thickness |
Continuous |
0.3 |
4.5 |
mm |
|
Long |
Continuous |
5 |
23 |
mm |
Table 4CoP matrix of LC, MC, and SC [%]
Table 4
|
LC |
MC |
SC |
|
L1 |
L2 |
L3 |
P2 |
Total |
L1 |
L2 |
L3 |
P2 |
Total |
L1 |
L2 |
L3 |
P2 |
Total |
|
R1 |
6.3 |
15.2 |
46.2 |
39.9 |
98.3 |
40.7 |
12.5 |
30.1 |
16.4 |
96.2 |
24.5 |
23.7 |
40.6 |
38.0 |
92.9 |
|
R2 |
16.7 |
1.0 |
49.2 |
52.4 |
94.2 |
46.4 |
10.1 |
31.1 |
25.4 |
90.6 |
42.8 |
4.2 |
64.3 |
19.8 |
98.8 |
|
R3 |
6.8 |
15.9 |
45.1 |
41.5 |
97.7 |
37.0 |
14.1 |
32.4 |
17.9 |
97.8 |
23.8 |
24.7 |
42.3 |
37.8 |
92.8 |
|
R4 |
73.8 |
5.6 |
15.0 |
16.7 |
92.8 |
85.6 |
0.0 |
0.0 |
10.8 |
94.6 |
59.8 |
16.1 |
39.4 |
18.8 |
90.9 |
|
R5 |
0.9 |
0.0 |
4.1 |
93.8 |
99.1 |
4.4 |
0.2 |
14.0 |
78.4 |
99.4 |
0.3 |
0.4 |
0.3 |
97.1 |
99.2 |
|
R6 |
7.7 |
45.6 |
14.7 |
22.2 |
90.3 |
0.0 |
67.2 |
21.2 |
12.4 |
96.2 |
13.2 |
67.5 |
20.7 |
24.1 |
94.1 |
Table 5Prediction accuracy of metamodels [%]
Table 5
|
R1 |
R2 |
R3 |
R4 |
R5 |
R6 |
|
LC |
98.3 |
98.3 |
99.9 |
98.4 |
96.3 |
97.8 |
|
MC |
99.7 |
96.3 |
98.8 |
97.4 |
99.9 |
87.2 |
|
SC |
99.8 |
97.1 |
99.9 |
97.9 |
99.6 |
90.6 |
Table 6
Table 6
|
Expression |
Criterion |
Limit |
|
MAX_AVER |
Abs (R2 – R3) |
Min |
- |
|
MIN_AVER |
Abs (R1 – R3) |
Min |
- |
|
LONG_SHORT_PR |
Abs (R4 – R5) |
Min |
- |
|
Safety |
R6 |
≤ |
19 MPa |
Table 7Parameter values of optimized designs
Table 7
|
P2 [kPa] |
Short [mm] |
Thickness [mm] |
Long [mm] |
|
Design 1-LC |
33.1 |
2.23 |
0.446 |
15.5 |
|
Design 2-LC |
54.2 |
2.14 |
0.443 |
15.3 |
|
Design 3-LC |
57.4 |
2.54 |
0.443 |
18.9 |
|
Design 1-MC |
34.7 |
2.64 |
0.660 |
15.2 |
|
Design 2-MC |
82.0 |
2.46 |
0.744 |
13.6 |
|
Design 3-MC |
61.0 |
2.43 |
0.603 |
14.8 |
|
Design 1-SC |
82.0 |
0.126 |
1.79 |
16.7 |
|
Design 2-SC |
82.0 |
1.90 |
0.757 |
15.7 |
|
Design 3-SC |
82.0 |
1.26 |
1.27 |
16.2 |
REFERENCES
- 1. Lee, H., Lee, D., Jeong, H., (2016), Mechanical aspects of the chemical mechanical polishing process: A review, International Journal of Precision Engineering and Manufacturing, 17(4), 525-536.
- 2. Cho, Y., Kim, M., Hong, M., Han, J., Kim, H. J., Kim, H., Lee, H., (2025), Prediction of normalized material removal rate profile based on deep neural network in five-zone carrier head CMP system, International Journal of Precision Engineering and Manufacturing-Green Technology, 12(3), 869-883.
- 3. Zhao, D., Lu, X., (2013), Chemical mechanical polishing: Theory and experiment, Friction, 1(4), 306-326.
- 4. Lee, H. S., Jeong, H. D., Dornfeld, D. A., (2013), Semi-empirical material removal rate distribution model for SiO2 chemical mechanical polishing processes, Precision Engineering, 37(2), 483-490.
- 5. Lee, H., Park, Y., Lee, S., Jeong, H., (2013), Effect of wafer size on material removal rate and its distribution in chemical mechanical polishing of silicon dioxide film, Journal of Mechanical Science and Technology, 27(3), 2911-2916.
- 6. Park, Y., Lee, H., Lee, Y., Park, S., Jeong, H., (2013), Effect of contact angle between retaining ring and polishing pad on material removal uniformity in CMP process, International Journal of Precision Engineering and Manufacturing, 14(9), 1513-1518.
- 7. Lee, J. W., Lee, D. S., Jeong, S. H., Kim, H. J., Park, B. J., Jeong, H. D., (2018), Analytical study of contact stress on wafer edge in CMP, Journal of the Korean Society for Precision Engineering, 35(2), 157-161.
- 8. Seguchi, Y., Satake, U., Enomoto, T., (2025), Improved polishing process for silicon wafers in semiconductor manufacturing, Procedia CIRP, 134, 139-144.
- 9. Park, Y., Jeong, H., Choi, S., Jeong, H., (2013), Planarization of wafer edge profile in chemical mechanical polishing, International Journal of Precision Engineering and Manufacturing, 14(1), 11-15.
- 10. Park, J., Hong, S., Lee, S., Jin, Y., Kim, T., (2019), Investigation of step structure in CMP retainer ring to improve within-wafer non-uniformity, Journal of Mechanical Science and Technology, 33(7), 3391-3395.
- 11. Ye, X., Zeng, Q., Sun, R., Zhang, T., (2025), Torque optimization strategy for outer rotor permanent magnet brushless dc motor based on metamodel and CRITIC–TOPSIS Method, Electrical Engineering, 107(2), 1643-1658.
- 12. Lee, H., Jeong, H., (2011), A wafer-scale material removal rate profile model for copper chemical mechanical planarization, International Journal of Machine Tools and Manufacture, 51(5), 395-403.
- 13. Veyhl, C., Belova, I. V., Murch, G. E., Öchsner, A., Fiedler, T., (2010), On the mesh dependence of non-linear mechanical finite element analysis, Finite Elements in Analysis and Design, 46(5), 371-378.
- 14. Wang, D., Lee, J., Holland, K., Bibby, T., Beaudoin, S., Cale, T., (1997), Von Mises stress in chemical-mechanical polishing processes, Journal of The Electrochemical Society, 144(3), 1121-1127.
- 15. Wang, Y., Ku, L., Suo, S., Dang, Y., Ge, Z., Yan, Z., Zhou, Q., (2013), Finite element analysis on von Mises stress distributions of Si DSP, Materials Science in Semiconductor Processing, 16(1), 165-170.
- 16. Calle, A. R., Baca, G. A., Gonzales, S., (2022), Optimization of the eolic cell to improve the wind velocity augmentation effect through the metamodel of optimal prognosis, Energy Conversion and Management: X, 16, 100330.
- 17. McKay, M. D., Beckman, R. J., Conover, W. J., (2000), A comparison of three methods for selecting values of input variables in the analysis of output from a computer code, Technometrics, 42(1), 55-61.
- 18. Most, T., Will, J., (2008), Metamodel of optimal prognosis: An automatic approach for variable reduction and optimal metamodel selection, Proceedings of the Weimar Optimization and Stochastic Days, 1-21.
- 19. Lancaster, P., Salkauskas, K., (1981), Surfaces generated by moving least squares methods, Mathematics of Computation, 37(155), 141-158.
- 20. Cressie, N., (1990), The origins of kriging, Mathematical Geology, 22(3), 239-252.
- 21. Im, Y., Jo, H., Oh, C., Cho, Y. S., Yoo, J., Lee, H., Lee, M., Yaddanapudi, V. K., (2022), Thermal model simplification of mobile device with adaptive metamodel of optimal prognosis (AMOP), Proceedings of the InterSociety Conference on Thermal and Thermomechanical Phenomena in Electronic Systems (ITHERM), 1-6.
- 22. ANSYS Inc, (2023), Methods for multi-disciplinary optimization. https://ansyshelp.ansys.com/public/Views/Secured/corp/v251/en/pdf/optiSLang_Methods_for_Multi-Disciplinary_Optimization_and_Robustness_Analysis.pdf
- 23. Mattson, C. A., Messac, A., (2005), Pareto frontier based concept uncertainty with visualization selection, Optimization and Engineering, 6(1), 85-115.
- 24. Goodno, B. J., Gere, J. M., (2018), Mechanics of materials. 9th Edition, Cengage Learning.
- 25. Lin, Y. Y., (2007), Influence of a retaining ring on strain and stress in the chemical mechanical polishing process, Materials and Manufacturing Processes, 22(7–8), 871-878.
Biography
- Do Yeong Jung
M.S. candidate in the Department of Mechanical Engineering, Dankook University. His research interests are fuel cells using computational fluid dynamics, finite element method, metamodel, and chemical mechanical planarization.
- Seung Heon Lee
M.S. candidate in the Department of Mechanical Engineering, Dankook University. His research interests are Finite element method, metamodel, and deposition and characterization of thin films using computational fluid dynamics.
- Jae Phil Boo
CEO of DRC Tech. He previously worked at Samsung Electronics. His interests are design and manufacturing retainer ring for the chemical mechanical planarization.
- Jung Woo Lee
CEO of Siltrex Co., Ltd. He previously served as Executive Director at Greenspec Co., Ltd. and as Manager at Korea Ebara Precision Machinery Co., Ltd. He received his B.S. degree in Electronic Engineering from Soongsil University.
- Byoung Wan Kim
Executive Director at Siltrex Co., Ltd. He previously worked at DB HiTek as a member of the CMP Equipment Engineering Team, where he operated and maintained CMP systems including AMAT, EBARA, Speedfam Ipec, and DNS. He received his associate degree in electronic engineering from Daedeok College.
- Gu Young Cho
Assistant Professor in the Department of Mechanical Engineering, Dankook University. He received his Ph.D. in Mechanical and Aerospace Engineering from Seoul National University. His research interests are fabrication and characterization of fuel cells, deposition and characterization of thin films.